Bubbles: Part 1
This is the first part of a series on bubbles in the U.S. Equity Market I will be publishing this summer.
Introduction
The problem with writing about bubbles is that bubbles are hard to define. More troubling is that bubbles are almost always identified ex-post. For example, some claim there was a bubble in the U.S. housing market from 2001-2007 (see Philips and Yu, 2011) because prices went up a lot and subsequently fell. While mechanically this is true, I’m not convinced a price rise and fall is enough to constitute a bubble.
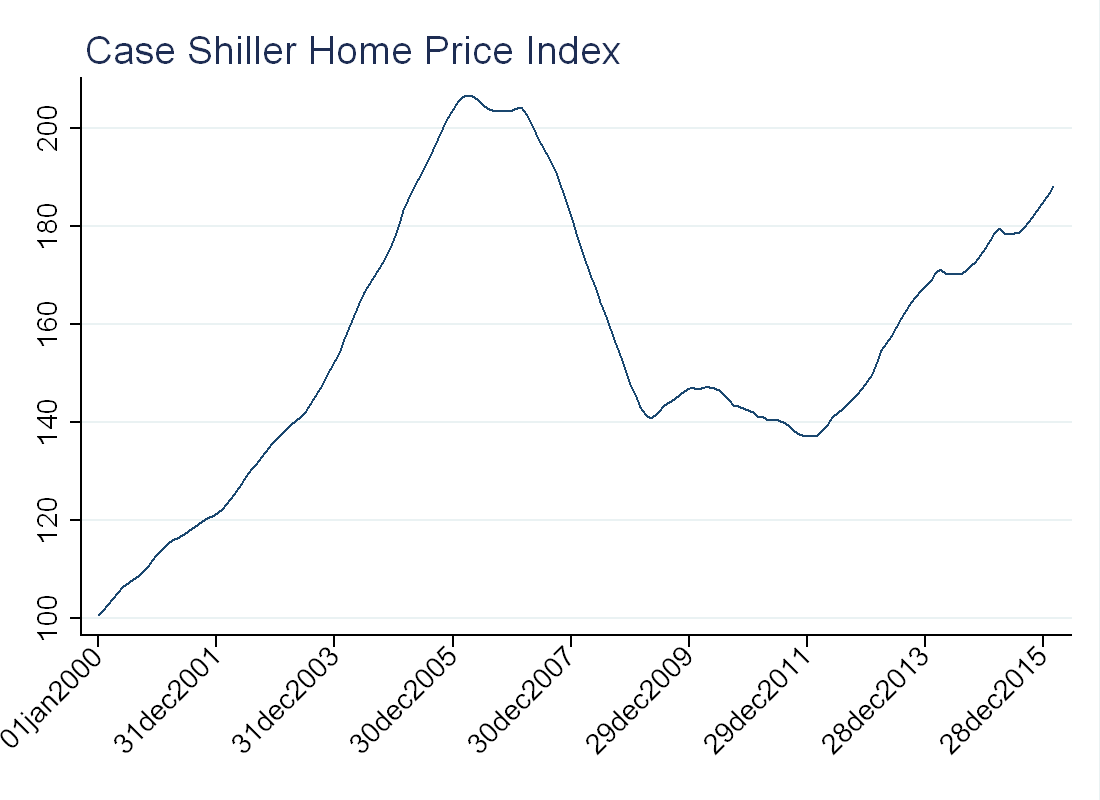
To justify the use of the word bubble, some argue that the asset somehow deviated from fundamental value. This too, can be tricky, as during the growth of the housing “bubble”, the U.S. had low interest rate, large foreign capital inflows and relaxed lending standards. These are all “fundamental” reasons why housing prices should have gone up during that time.
Asset Pricing Approach
In an introduction to asset pricing, you might see the following:
Consider a 2-period asset pricing model, an agent chooses asset \(a_t\) to maximize:
\begin{equation}
u(c_t)+E_t[\beta u(c_{t+1})]
\end{equation}
Such that:
\begin{equation}
\begin{split}
c_t=e_t-a_t p_t
c_{t+1}=e_{t+1}+a_t x_{t+1}
\end{split}
\end{equation}
Solution:
\begin{equation}
p_t=E_t\Bigg[\beta\frac{u’(c_{t+1})}{u’(c_t)}x_{t+1}\Bigg]
\end{equation}
Now, suppose the asset pays dividends, and we extend the model to infinitely many periods, then the solution is:
\begin{equation}
p_t=E_t \Big[\sum\limits_{j=1}^{\infty} \beta^j\frac{u’(c_{t+j})}{u’(c_t)}D_{t+j} \Big]
\end{equation}
Conditional on imposing the transversality condition:
\begin{equation}
lim_{j\rightarrow \infty}E_t\Big[\beta^j \frac{u’(c_{t+j})}{u’(c_t)} p_{t+j}\Big]=0
\end{equation}
This is often called the “no-bubbles” condition, as with this assumption, the price is determined entirely by fundamental value (dividends). Another way to think about this is that the price is not going up so fast that people are buying just to re-sell at a higher price.
Some authors like Phillips and Yu (2011) use this idea to create a purely statistical definition of a bubble. If the “no-bubbles” condition holds, then prices should be a random walk with drift, but if not, prices will exhibit exponential growth. The authors use right-sided Dickey-Fuller tests to determine if stocks are exhibiting bubble-like behavior (the discussion here is cut short as this will be the topic of a future blog post).
Back to Basics
The literature on bubbles is vast, and it will be discussed more in future posts. Rather than use econometric techniques or write down a theory model, I wanted to identify “bubble” stocks with very few assumptions. To start, I downloaded all the daily price data from The Center for Research in Security Prices (CRSP) for 2015. I then applied the following filters:
1) Remove all stocks that were not trading for the whole years.
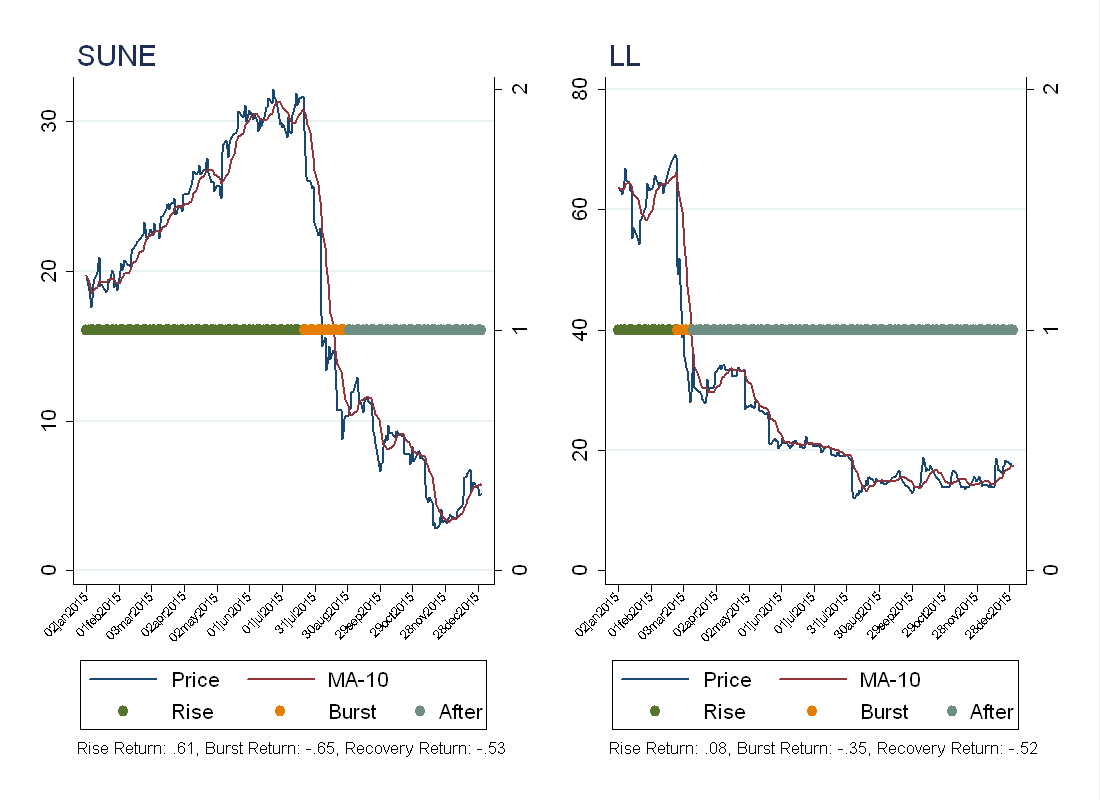
2) Take a 10-day moving average of the price. For each stock, split the year into two types of regimes, when the stock is trading above/below the 10-day moving average. Take the worst return among all regimes, and call this the burst period (call the pre-burst period the “rise” and the post-bust period the “after”). Then keep only those stocks with at least a 50-percent rise, and at least a 30-percent fall.
As a first pass, these are the stocks we’re interested in.
Results
Going in, I had a few names that I thought would be good bubble candidates. I was interested in Sunedison (SUNE) and Lumber Liquidators (LL), see below for the plots, and the regimes the algorithm identified.
To see if we have the right idea, I randomly picked one of the identified stocks, here is the chart:
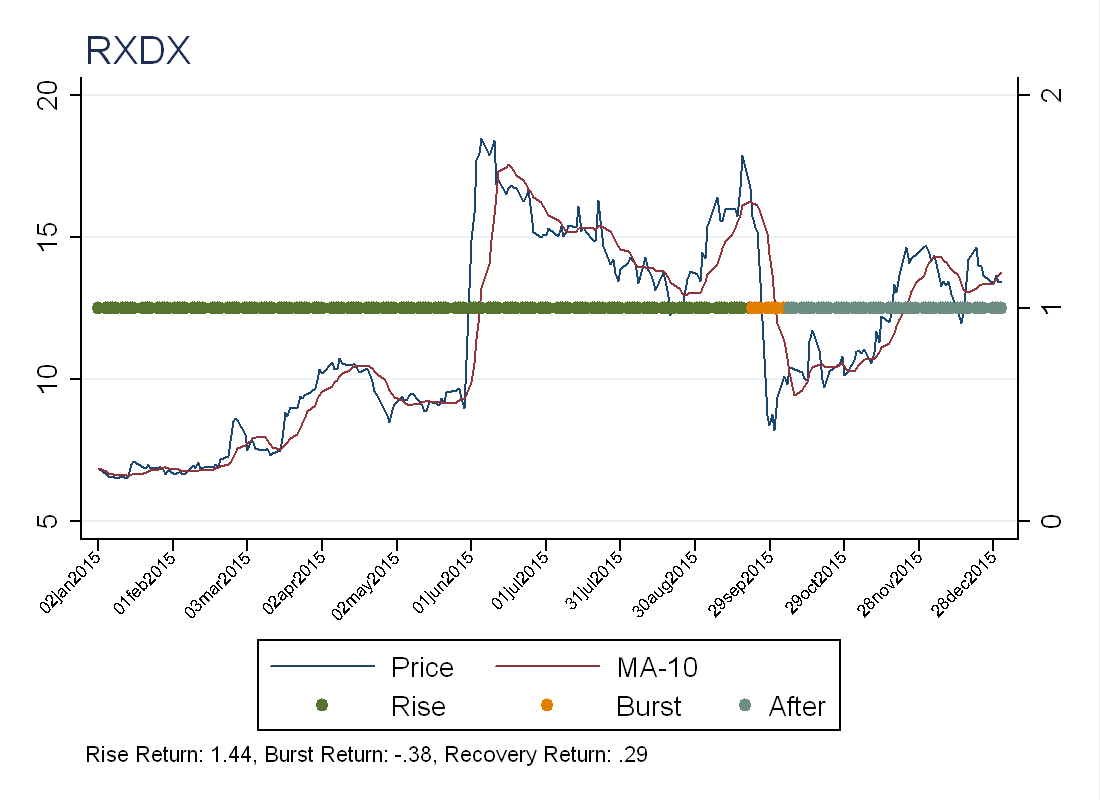
The chart seems promising, as we get a rapid rise and a rapid fall. Doing a little more research, we can see that RXDX is a biotechnology firm that produces oncology medicines. They lost money in every quarter of 2015 (with the largest loss in the 4th quarter) so this does not explain the price behavior. The biggest decline during the burst was September 25 (Friday)-September 28 (Monday). Looking at their press releases we can see that they released a clinical trial result on September 27 (Sunday), so it seems like perhaps investors were expecting a better result in the clinical trial (see press release) that did not materialize.
It’s not immediately obvious that this price rise and fall were not justified by fundamentals. Maybe investors thought the new drug was very promising, and given the potential upside, it was “rational” to buy at such a high price. We can only say they were wrong ex-post.
Future Work
The method discussed above identified 165 stocks in 2015 that exhibited bubble-like behavior. The next step is to look more closely into these stocks, and determine what caused their rise and fall. The goal is identify a systematic pattern among stocks that exhibit this kind of price behavior.