Logs vs. Levels
Motivation
In the finance literature, authors seem to use returns, \(R\): \begin{equation} R_{t+1}=\frac{p_{t+1}}{p_t} \end{equation} and log returns, \(r\): \begin{equation} r_{t+1}=log\left( \frac{p_{t+1}}{p_t} \right)=log(R_{t+1}) \end{equation} interchangeably (this notation is standard, following the convention that lower case variables are the logs of upper case variables). This post shows how the choice of logs vs. levels can affect basic results in a big way.
First Order Approximation
Consider the first order Taylor expansion of \(log(1+x)\) about \(x=0\):
\begin{equation}
log(1+x) \approx x
\end{equation}
Think of \(x\) as percent returns, \(x=\frac{p_{t+1}-p_t}{p_t}\). Recalling that \(\frac{p_{t+1}-p_t}{p_t}+1=\frac{p_{t+1}}{p_t}\), this approximation implies that \(log(p_{t+1}/p_t)\approx \frac{p_{t+1}-p_t}{p_t}\).
Log returns are useful, as compounding can be done through addition, rather than multiplication. In levels, total return is calculated as:
\begin{equation}
R_{total}=R_1 \cdot R_2 \cdot \dots \cdot R_n
\end{equation}
This works because \(R_{t}=p_{t}/p_{t-1}\), so \(R_{total}=p_{n}/p_{0}\).
In logs, total return is calculated as:
\begin{equation}
r_{total}=r_1 + r_2 + \dots + r_n
\end{equation}
This works because \(r_{t}=log(p_t/p_{t-1})=log(p_t)-log(p_{t-1})\) so \(r_{total}=log(p_{t+n}/p_t)\).
Approximation Error
The table below presents values of \(x\) between \(-0.26\) and \(0.26\), the corresponding approximation, and the approximation error.
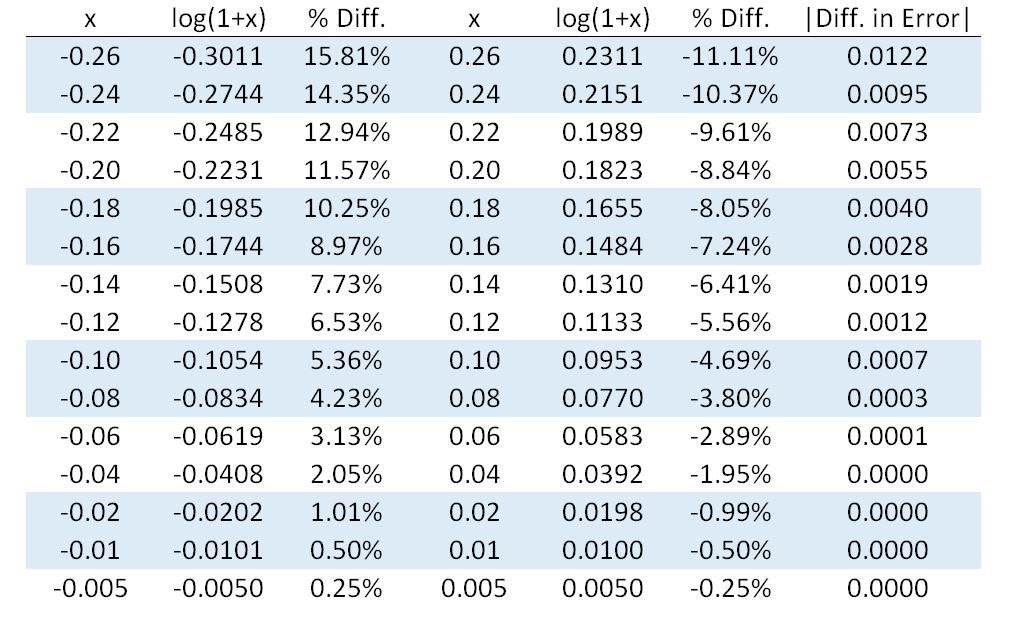
Three important takeaways from this table:
1) The approximation error is small for values of \(x\) close to zero, but substantial for \(|x|>0.2\).
2) The approximation error is asymmetric about zero for \(|x|>0.01\) - it is larger for \(-x\) than \(x\).
3) The error direction is also asymmetric- negative values of \(x\) are amplified, while positive values of \(x\) are dampened.
S&P 500 Data
Consider the price dividend ratio, P/D, for the S&P 500 index, and log(P/D) (Source: Robert Shiller )
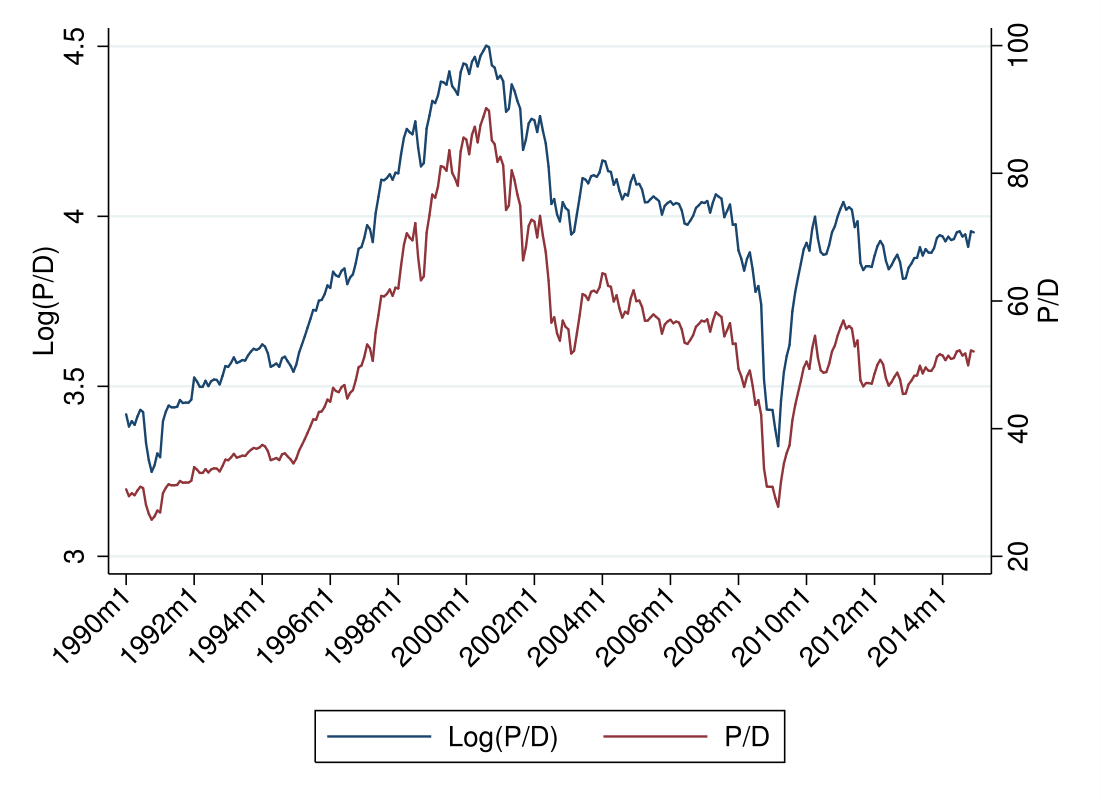
During the technology “bubble”, P/D in levels appears to increase exponentially, while in logs it looks almost linear (this makes sense, \(log(e^x)=x\)). During the financial crisis, the drop in logs is much more severe in than the drop in levels.
This reveals a bigger point - a rising series will look more dramatic in levels, and a falling series will look more dramatic in logs.
Summary
Using logs is very convenient, as working with addition is always easier than working with multiplication. Further, the overwhelming majority of stock returns are between -0.05 and 0.05, where the approximation error is small. This breaks down during extreme events, when the approximation error causes the two methods to materially differ. When trying to describe “bubbles” and “crises”, it is important to consider the impact of choosing to logs vs. levels, as it could substantially alter the results.