How to Invest like a Billion Dollar Hedge Fund
Investing in hedge funds is expensive - you are charged management fees, performance fees or both. On top of that, some funds enforce minimum investments and lockup periods. This post describes how to invest like a hedge fund, without the fees and restrictions.
SEC Filings
No hedge fund will tell you exactly how their strategy works, but every quarter, institutions managing over $100 million must report specific holdings in 13F filings (see the SEC’s website for more information). This information isn’t enough to exactly replicate a hedge fund’s equity portfolio, as you only get end of quarter holdings. For example: If a fund enters and exits a position within a quarter, it won’t show up in the 13F. Further, there is a delay of up to 45 days between the end of the quarter and the 13F filing.
Manager Selection
According to Reuters, there were over 10,000 hedge funds operating in 2015. To get a manageable number of fund managers, I started with Insider Monkey’s 20 “Billionaire Hedge Funds”. The “billionaire” part is based on total assets, not public stock holdings, which is why BP Capital is included, even though its equity portfolio is “only” $200 million.
This list is not representative of the average hedge fund. These funds are the largest because they’ve been successful. This selection bias doesn’t affect my results, however, as you can select a hedge fund to replicate based on any criteria, including past performance (whether or not this is a good idea is a separate question).
The list has 20 firms, but I didn’t use all of them. I omitted Ichan, Bridgewater and Tiger Management owing to gaps in their 13F filings. I’m concerned that the gaps might correspond to bad performance, and that using only the non-missing years overestimates their actual returns. This introduces meaningful selection bias, as you will not know how long a reporting gap will last (or even if it will happen at all) in real time. Another change is using S.A.C. Capital instead of Point72 for Steve Cohen. Unlike Mr. Cohen, you wouldn’t have to pay a $1.8 billion insider trading fine for replicating his portfolio.
Even though these funds are all considered “Institutional Investment Managers” by the SEC, they have totally different objectives. Berkshire Hathaway fully owns business in a variety of industries (insurance, food, industrial chemicals), while others hold no majority stakes. These funds also have different investments styles - Third Point is known for value investing while Renaissance Technologies is known for algorithmic trading. Finally, they are managing money for different reasons. Some take money from outside investors, while others are “family offices” (they manage the wealth for a single family). All of these factors affect the firms’ incentives, and are important when picking a firm to replicate.
Data and Portfolio Construction
13F filings are collected from Thompson Reuters (data from 2013 onward is easy to scrape from the SEC website - this will be the topic of a future blog post). Funds are indexed by manager number, which may change over time. For example, Tudor Investment Corp and Tudor Investment Corporation overlap for two quarters and have different manager numbers. I manually fixed these cases to ensure each manager only has one observation per quarter.
Stock price and return data are from CRSP. I match CRSP to the 13F data on CUSIP. For the holdings that I can’t match on CUSIP, I match on historical CUSIP (NCUSIP).
I construct the hedge fund replicating portfolios as in Section 5 of “Buffett’s Alpha” by Frazzini, Kabiller and Pedersen. I get equity holdings (the 13F also includes equity options and other securities) from the 13F filings, and rebalance the portfolios quarterly. For each fund, I calculate value weights based on the size of their stake in a particular stock (price times shares held), relative to the total size of their public holdings. The weights are kept constant within a given quarter (if a firm delists for any reason before the end of the quarter, I calculate the delisting return, and put the remaining money in cash). I use the 13F holdings at the end of quarter \(t\) to form portfolios and calculate value weights for quarter \(t+1\). As mentioned above, this induces a look-ahead bias, as firms may take up to 45 days to actually file their 13F. I replicate the results without a look-ahead bias later in the post.
Excess returns are calculated as returns minus the risk-free rate. The asset pricing factors are: Market (the excess return on the CRSP value-weighted portfolio), SMB (size), HML (value) and UMD (momentum), which along with the risk-free rate, are obtained from Ken French’s data library. I also use BAB (betting against beta), and QMJ (quality minus junk), which are from AQR’s website.
Performance Overview
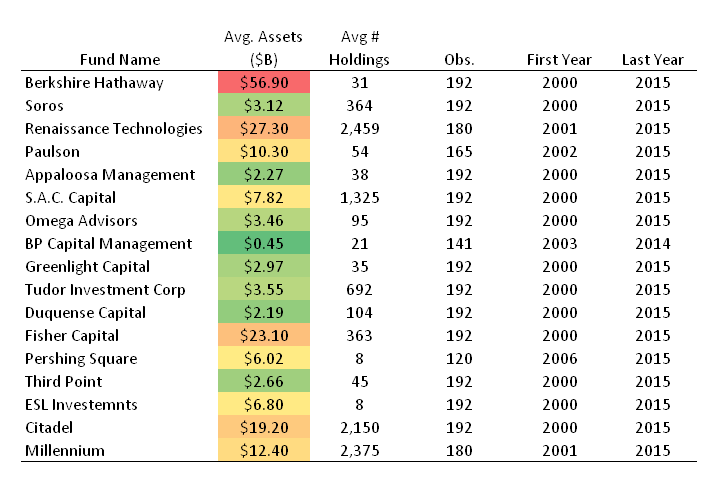
It’s difficult to compare fund performance. As mentioned above, funds have different styles and different types of investors. In addition, the funds under consideration range in size from under $1 billion to over $50 billion in equity holdings. Large funds might have a hard time beating the market, as they are restricted to investing in larger companies and/or holding a larger number of companies. This isn’t universally true, however, as Berkshire’s equity portfolio is 10x the size of Duquense’s, but Dunquense has 3 times as many holdings:
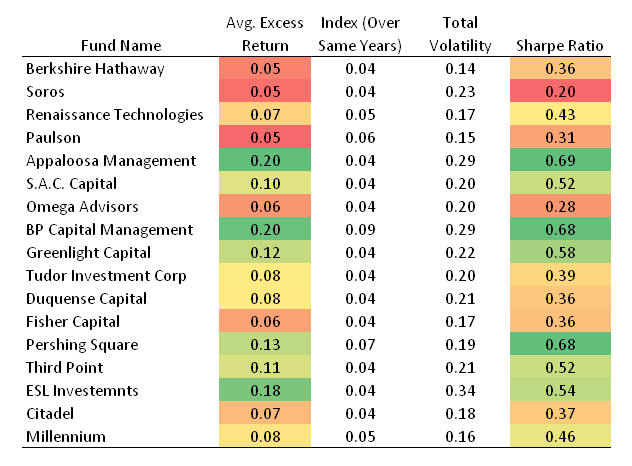
Every fund except Paulson’s has a higher average excess returns than the market between 2000 and 2015. Again, this is only looking at the most successful firms, so it’s not surprising they’ve done so well. Value investing firms like like Appaloosa Management and Third Point have the highest Sharpe Ratios (for reference, the market Sharpe Ratio from 2000-2015 was 0.28):
To test for manager “skill”, I ran a regression of excess returns on 5 asset pricing factors. Alphas are annualized (multiplied by 12):
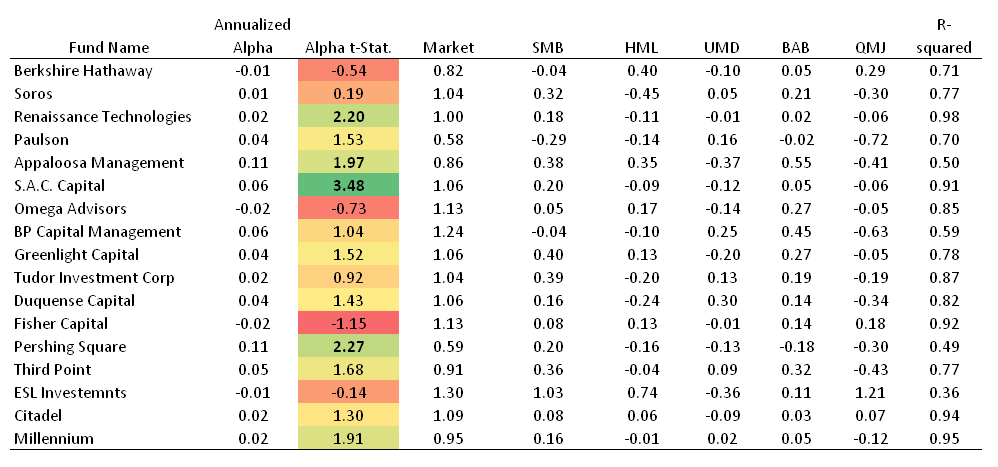
The largest (and most statistically significant) alpha belongs to S.A.C. - a firm which plead guilty to insider trading. Other significant alphas include activist investor Bill Ackman (Pershing Square) and value investor David Tepper (Appaloosa Management). Historical alphas and Sharpe Ratios suggest these funds are good candidates for replication (they also hold few equities - so even small investors could replicate their portfolios).
Hedge Fund Replication
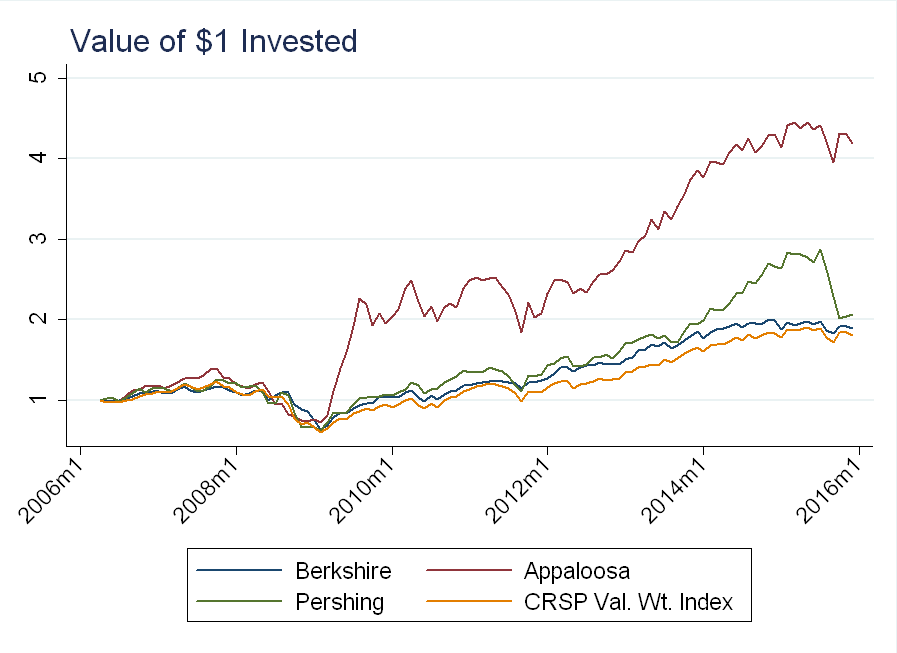
Below I plot the performance of the replicating portfolios for Berkshire, Appaloosa and Pershing:
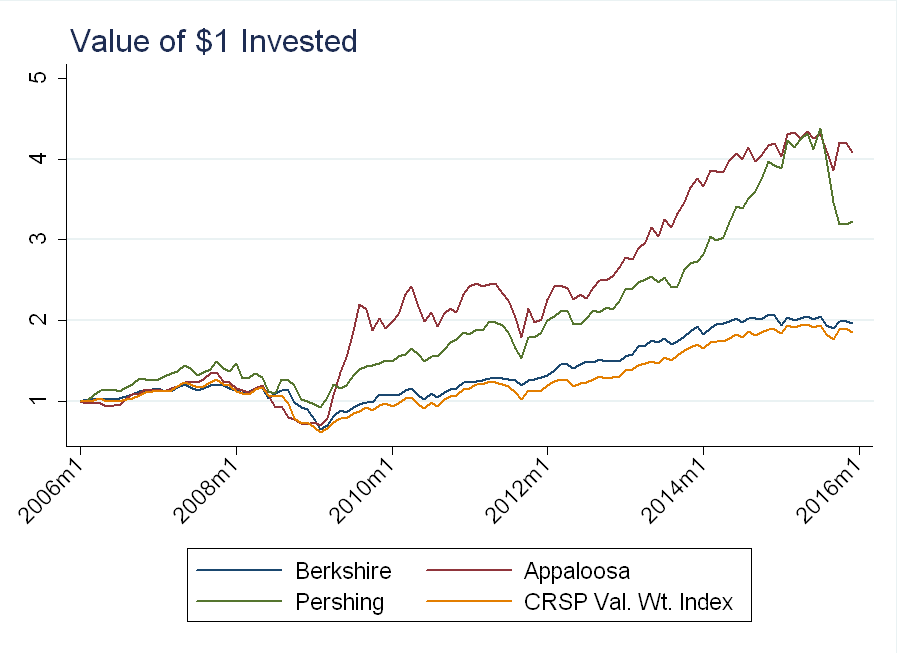
I started the series in 2006, as the first 13F for Pershing is from December, 2005. Had you replicated Berkshire’s portfolio, you would have roughly tracked the market, while the other replicating portfolios nearly doubled the market.
Stopping the Look-Ahead Bias
The authors of, “Buffett’s Alpha” have a look-ahead bias (up to 45 days) in their calculation of the 13F portfolio. It doesn’t matter for their paper, as they are doing a historical analysis (understanding why Buffett performed so well), but it matters for matching hedge fund strategies.
I re-calculated everything, adding an extra quarter delay between the 13F’s due date, and when the holdings are used to form portfolios - now, the data are available for at least 45 days before forming portfolios. Not surprisingly, this changes nothing for Buffett (as his turnover is low), but it matters if you are trying to match other managers. For example, with an activist like Pershing Square, the alpha becomes statistically insignificant (q+1 uses the, “Buffett’s Alpha” methodology, while q+2 lags an extra quarter). Excess returns are (weakly) lower for all funds:
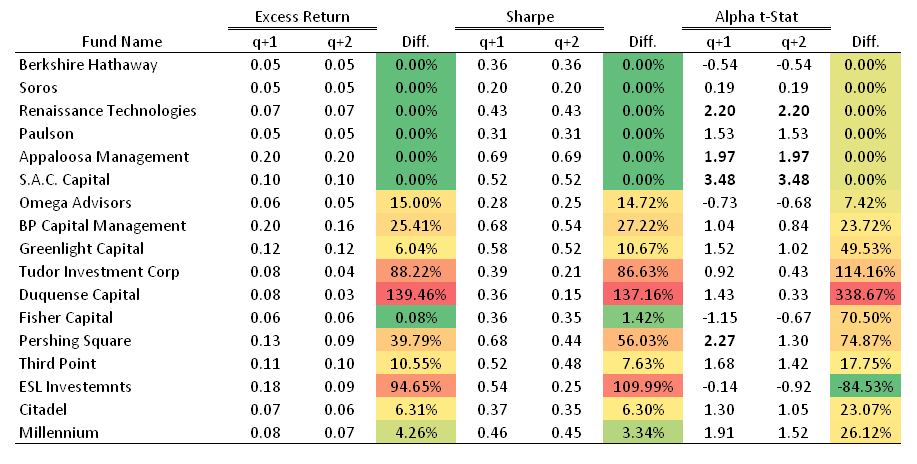
The portfolio replication results do not change much for Berkshire and Appaloosa, but it brings Pershing’s performance close to that of the market:
This suggests that portfolio turnover, and time-sensitivity of investment are important considerations when picking a fund to replicate.
Conclusion
Following 13F filings is not hard – the challange is picking the right 13F filings to follow! Almost all the hedge funds examined had higher average returns that then index, even after removing the look-ahead bias. If you want to invest like a hedge fund - and maybe beat the market - buy the 13F holdings from your fund of choice. But, be careful before investing in this strategy, as my results do not suggest that all replicating portfolios will beat the market - I ignored transaction costs and convexity (a 10% negative return, followed by a 10% positive return will result in a 1% overall loss).
Finally, just because a fund does well historically, doesn’t mean that performance will continue - so picking the “best” funds may not be the best strategy.