What's in a Name?
Given the success of companies like Apple, Amazon and American Express, I was curious if a company’s name could predict its expected return. It would be worrying if this worked, as there is no fundamental reason why companies starting with A-E should outperform companies starting with, say, F-J. Stories like stock screens returning results alphabetically or investors having an aversion to certain letters seem too far-fetched. I sort into portfolios based on the first letter of a company’s name to check this result.
Methodology
I get monthly stock data from 1980-2015 in CRSP, and restrict to ordinary common shares traded on major exchanges. At the end of every month, I extract the first character of a company’s name and give it a numerical value between 1 and 35:
Example 1: First character of 1-800 Flowers is, “1” and it is given a value of 1 (there are no names starting with 0)
Example 2: First character of Apple is “A” and it is given a value of 10
Example 3: First character of Zing Technologies is “Z” and it is given a value of 35
I then sort into 10 value-weighted portfolios based on deciles of this number (i.e. the bottom 10% of values are in portfolio 1, etc.). This allows the letter breakpoints to change slightly over time with changes in the frequency of first letters. Because this is a discrete measure, even within a month, portfolios don’t necessarily have the same number of securities. I tried making the portfolios contain the same number of securities and the results were similar.
In addition, I create an “HML” style factor factor, which is the return on portfolio 10 minus the return on portfolio 1 (reading it again, maybe ZMA - for Z minus A - would have been a better name).
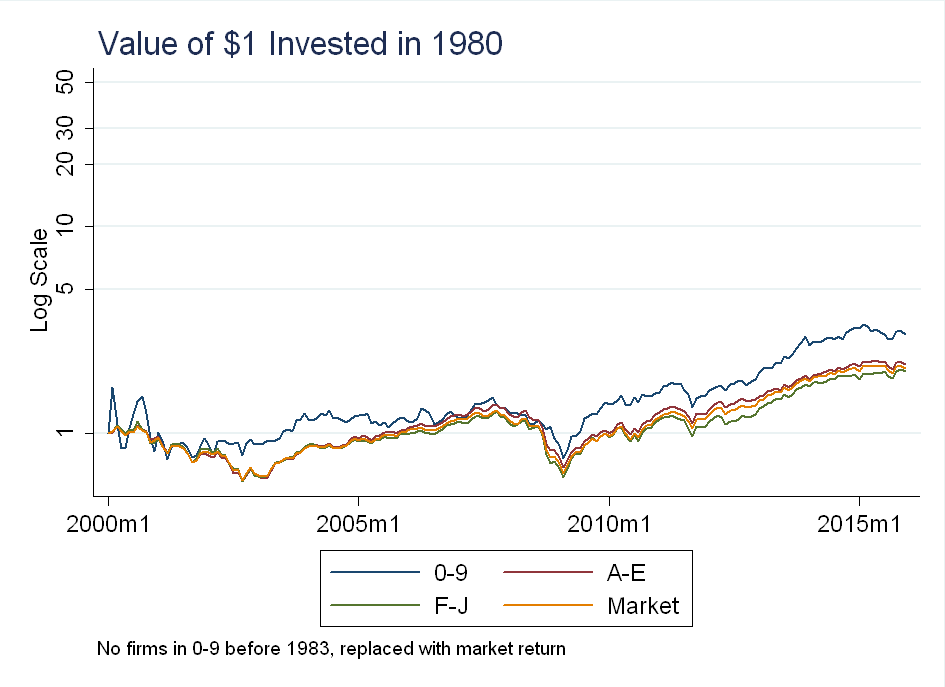
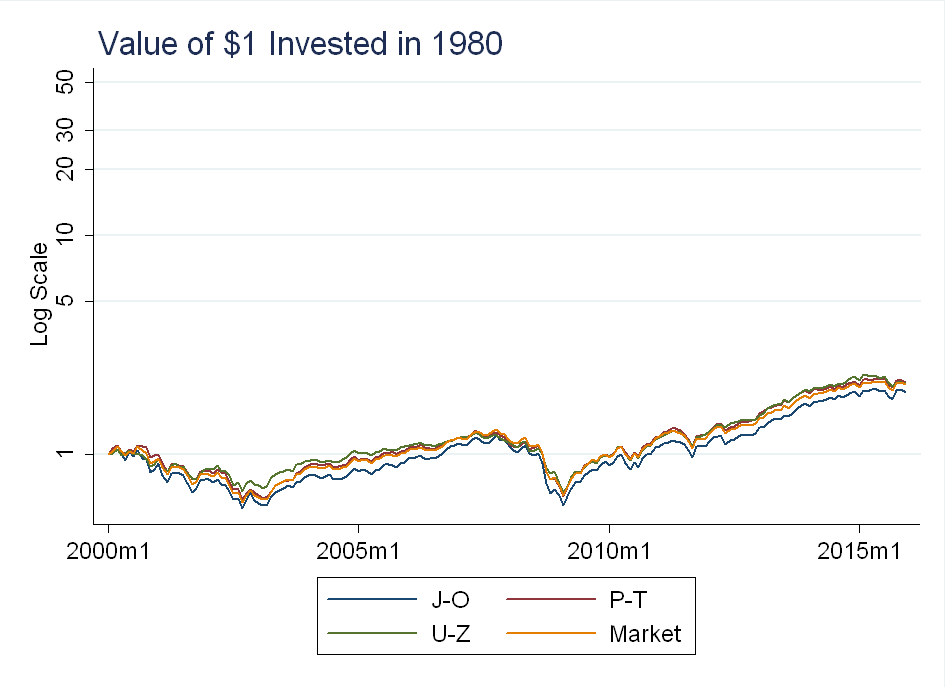
I also tried sorting into 6 value-weighted portfolios based on the first letter themselves: Companies starting with 1-9 are in portfolio 1 (although there are no companies like this before 1983), A-E are in portfolio 2, F-J are in portfolio 3, K-O are in portfolio 4, P-T are in portfolio 5, and U-Z are in portfolio 6. I construct another HML style factor, except this time it is portfolio 6 minus portfolio 2, because portfolio 1 is sparsely populated. Again, the portfolios will not have the same number of firms, as some first letters are more popular than others.
Empirical Results
The table below shows the annualized (multiplied by 12) average returns, annualized (multiplied by \(\sqrt{12}\)) standard deviation and annualized Sharpe ratio:
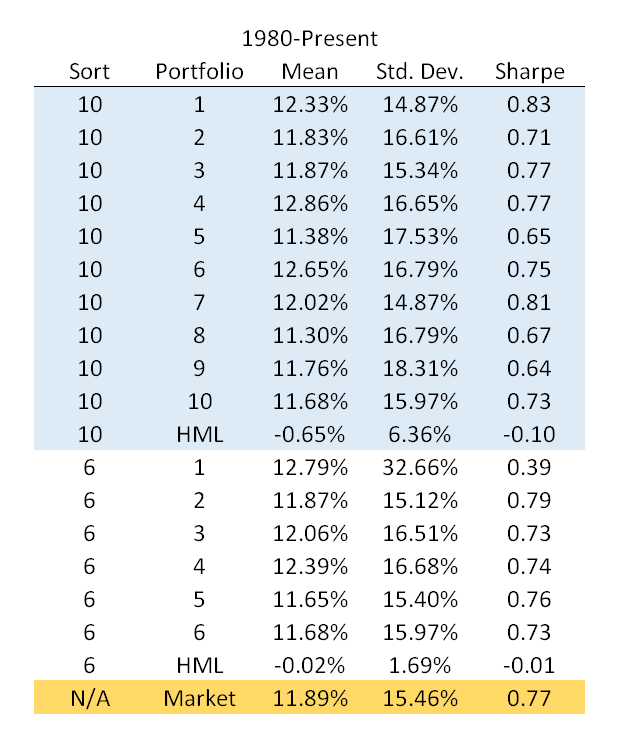
There is little difference in average returns across portfolios and sorting methodologies - they all pretty much track the market. The HML factors have an insignificant alpha once you control for market exposure.
For robustness, I calculated the same statistics using only data from 2000 to 2015:
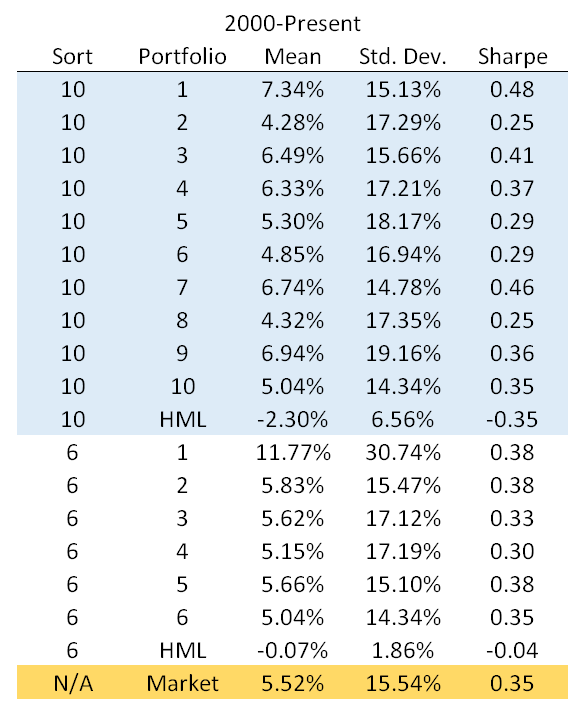
Post 2000, with the decile portfolios, the firms in portfolio 1 returned on average 2.3% more than firms in portfolio 10, and given this is based on deciles, it is not caused by portfolio 1 being sparsely populated. A t-test shows this difference is marginally statistically significant with \(p=0.08\). I thought it was being driven by a size effect (small companies names are more likely to start with a number), so I repeated the exercise for the largest 500 firms and the effect goes away. Even before excluding small firms the alpha was insignificant once controlling for market, SMB and HML exposure.
For the 6-portfolio sort, you can see they pretty much track the market (except for the 0-9 portfolio, which as mentioned above, is sparsely populated):
Conclusion
When searching for new asset pricing factors, it is important to avoid data-snooping. Here, I sorted on something that shouldn’t predict returns - and it didn’t - but I’m sure if I tried 20 more random sorts, one of them would create a new (totally spurious) factor. At least for now, alphabet risk is priced!
Update
In his 2016 presidential address for the American Finance Association, Campbell Harvey implemented a similar sorting on tickers. See here for the full text.