Do Weights Matter?
Many popular indices such as the S&P 500, Nasdaq 100 and the Wilshire 5000 are value weighted - a company’s weight in the index is proportional to its market-capitalization (price \(\times\) shares outstanding). This post explores alternative weighting methods and their implications.
The Nasdaq
Given previous posts on the Nasdaq, I decided to test alternative weighting schemes using only stocks traded on the Nasdaq exchange. For all schemes, I did the following:
1) Only include stocks that were traded at the end of the previous month
2) Adjust for delisting returns to prevent survivorship bias
3) Rebalance all portfolios on the first day of the month
4) Weights are constant over any given month
The weight under scheme \(x\), for company \(i\), at time \(t\), is denoted \(w_{i,t}^x\)
Value Weight and Equal Weight
Value weights and equal weights are by far the most used weighting schemes. Value puts the most weight on the largest companies and is calculated as follows:
\begin{equation}
w_{i,t}^{val}=\frac{mkt ~ cap_{i,t}}{\sum\limits_{j\in J} mkt ~cap_{j,t}}
\end{equation}
where \(J\) represents the set of all stocks trading at the end of the previous month. Some possible reasons for using value weights are that the largest companies are less sensitive to idiosyncratic risk and have the most liquid shares.
Equal weights are exactly what you would expect, giving each stock equal weight! They are calculated as:
\begin{equation}
w_{i,t}^{eq}=\frac{1}{J}
\end{equation}
As we will see below, equal weights can avoid some of the “momentum” built into value weights.
Weighting by Inverse Volatility
Suppose you wanted to put the most weight on the least volatile stocks. Let \(vol_i\) denote the standard deviation of stock \(i\)’s returns over the previous 12 months. I calculated inverse volatility weights as: \begin{equation} w_{vol,i}=\frac{vol_i^{-1}}{\sum\limits_{j\in J} vol_j^{-1}} \end{equation} Given that Sharpe ratio (see the post on Betting Against Winners) is decreasing in volatility, this might be a good way to construct a high Sharpe ratio index. The problem is, this is more like a trading strategy than an index. Unlike value weights, it doesn’t give a good indication of how the economy as a whole is performing.
Weighting by Beta
Suppose you wanted to put the most weight on the stocks that were the most responsive to movements in the S&P 500 (seems very risky!). Run the following regression for each stock \(i\): \begin{equation} r_{i,t}=\alpha+\beta^i r_{m,t} + \epsilon_{i,t} \end{equation} where \(r_i\) is stock \(i\)’s returns and \(r_m\) is the market return, as measured by the S&P 500 index. To calculate beta weights, I ran this regression over the previous 12 months using monthly data, and computed weights as follows: \begin{equation} w_{\beta,i}=\frac{|\beta^i|}{\sum\limits_{j\in J} |\beta^j|} \end{equation} Again, this seems more like a trading strategy than an index, but I thought including a high volatility strategy would be a good point of comparison to the inverse volatility weighting scheme.
Results
Imagine investing 100 dollars in each of these 4 indices in 1996, the plot below shows the performance of these portfolios:
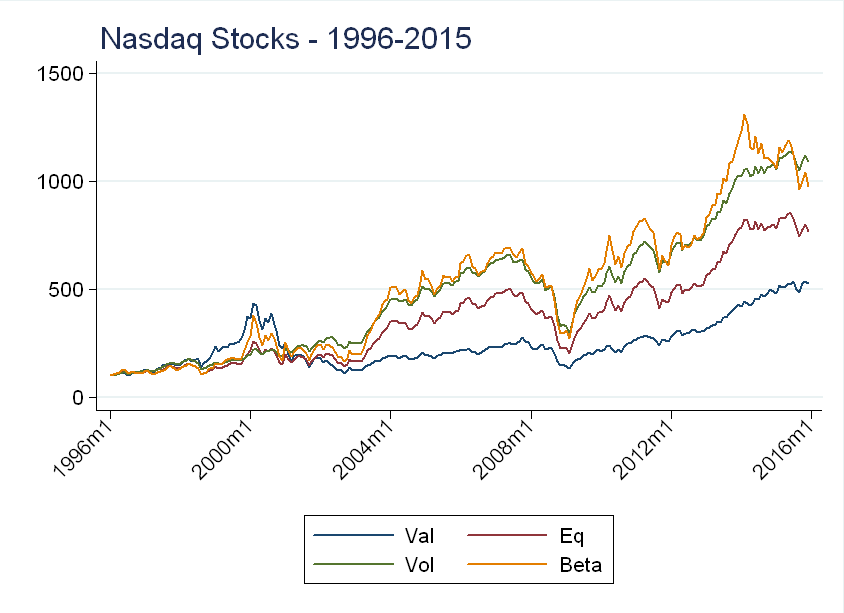
Recall, we are only looking at stocks traded on the Nasdaq index. The value weighted and beta weighted portfolios seem to pick up the technology “bubble”, while the inverse volatility weighted and equal weighted do not. This makes sense - as the “bubble” stocks became more “overvalued”, their market capitalization increased, so a value weighted index would put more weight on these stocks. Similarly, these stocks were very sensitive to overall market movements (recall their extreme daily volatility), so these stocks had high betas.
Below I compare the performance of these portfolios the S&P 500 over the same period:
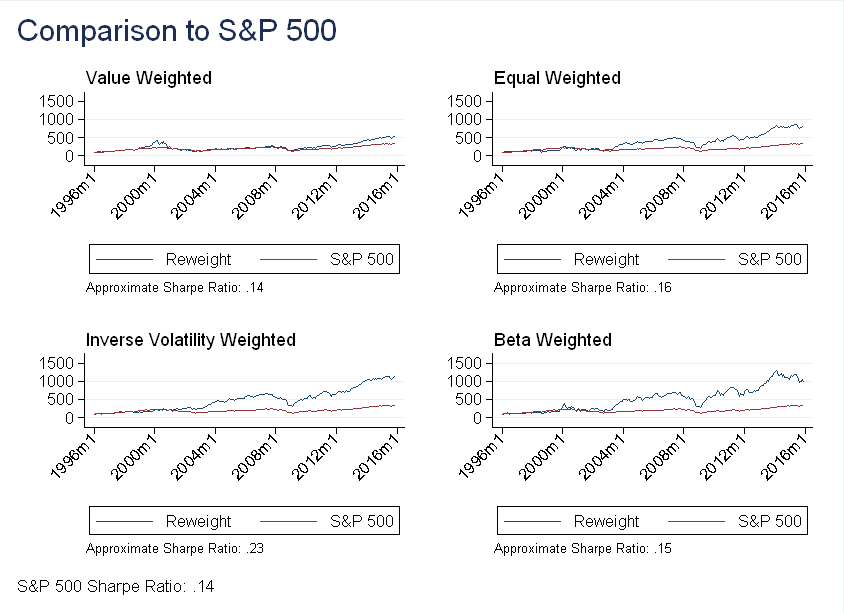
Unsurprisingly, the inverse volatility weighted portfolio has the highest Sharpe ratio (it’s approximate because it uses \(r_f=0\)). I was surprised, however, that despite its high average returns, the beta weighted portfolio has a lower Sharpe ratio than the equal weighted portfolio. As for why the equal weighted outperformed the value weighted - my guess is it may be related to the small stock effect (and this will be the topic of a future post).
Update: 9/4/2018
When re-reading this post, a recent paper came to mind: Replicating Anomalies, by Hou, Xue and Zhang. (SSRN Link). The paper shows that using value weights and NYSE breakpoints makes many anomalies insignificant. It turns out weights are more important than I ever could have expected when I originally wrote this post!