Private Equity
Over the past several years, many have discussed a possible “bubble” in private equity. This post explores publicly-traded private equity firms and their valuations.
Companies of Interest
Given available data, it is easiest to consider the 4 largest publicly traded private equity firms:
\(\begin{align*}
\begin{array}{ccc}
\mbox{Firm} & \mbox{Ticker} & \mbox{Mkt. Cap (Bil USD, Dec. 2015)} \\
\hline
\mbox{The Blackstone Group} & BX & 16.33 \\
\mbox{Kohlberg Kravis Roberts} & KKR & 7.25 \\
\mbox{Apollo Global Management} & APO & 2.75 \\
\mbox{The Carlyle Group} & CG & 1.25
\end{array}
\end{align*}\)
Motivation
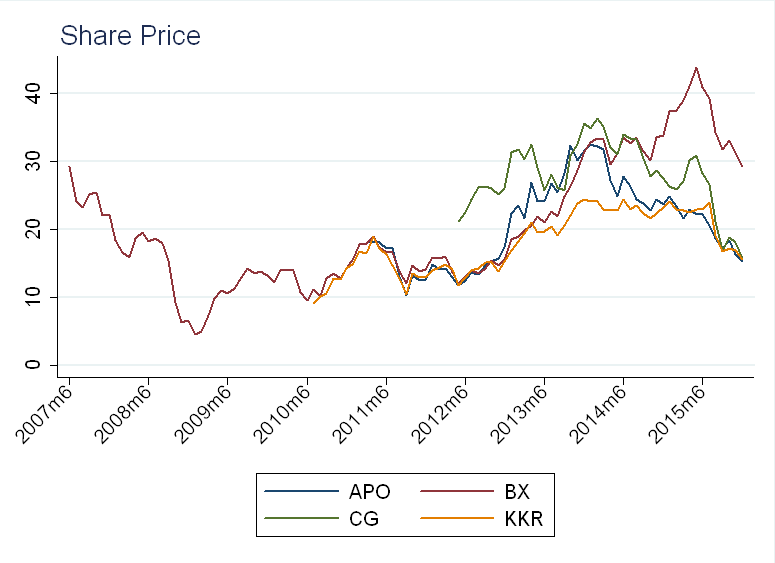
“Bubbles” are usually identified ex-post, and the discussion surrounding private equity is no exception. Just looking at prices, we see the characteristic rise and fall starting in 2012, and peaking in 2014:
All of these companies are older than their stock history suggests, having IPOs (initial public offerings) up to 30 years after the company was founded (these are IPO dates for the parent, not companies owned by the parent):
A company wants to IPO when valuations are high, to raise as much capital as possible. Given this, the clustering of private equity IPOs is more evidence of a “bubble” - it’s possible all the firms IPOed at the same time to take advantage of high (perceived) valuations.
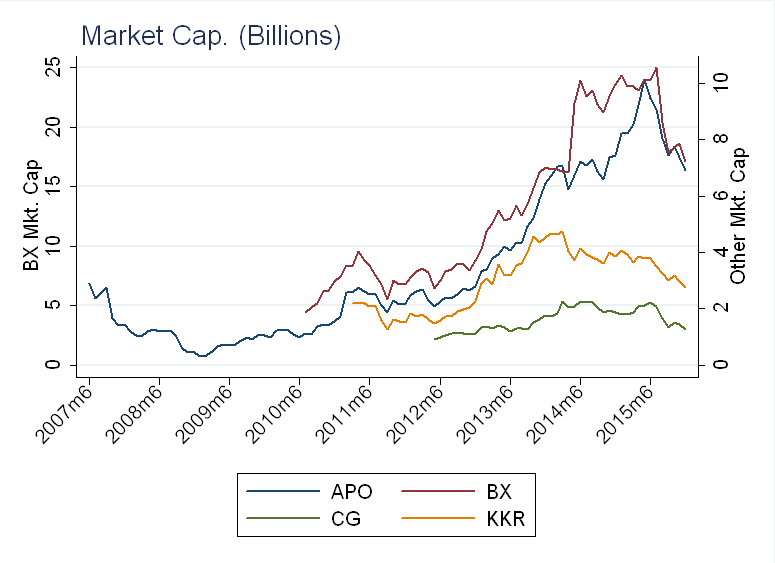
To account for the size of these companies, I plot the market capitalization (price\(\times\)shares outstanding) in Billions of USD for the 4 firms of interest.
Adding up the total market capitalization across all 4 companies, we can see a loss of over 10 Billion dollars from the peak in 2015.
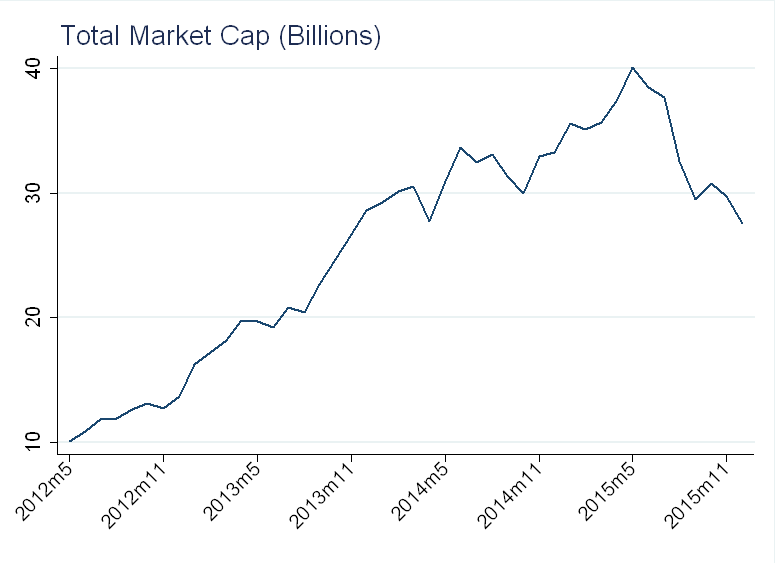
These kind of graphs are motivate discussion on bubbles - a loss of 10 billion dollars among 4 companies over a period of 6 months seems unlikely to be justified by any changes in fundamentals.
Valuation
As in previous posts, we want to relate prices to fundamentals using price-dividend ratio (\(P/D\)). Calculate \(D\) as total dividends paid over the previous 12 months. I plot the path for the private equity companies’ \(P/D\) ratios, as well as the S&P 500’s \(P/D\) (the \(P/D\) ratios are on separate axes because the level doesn’t matter - it differs widely across industries and companies - we care about changes, relative to historical levels).
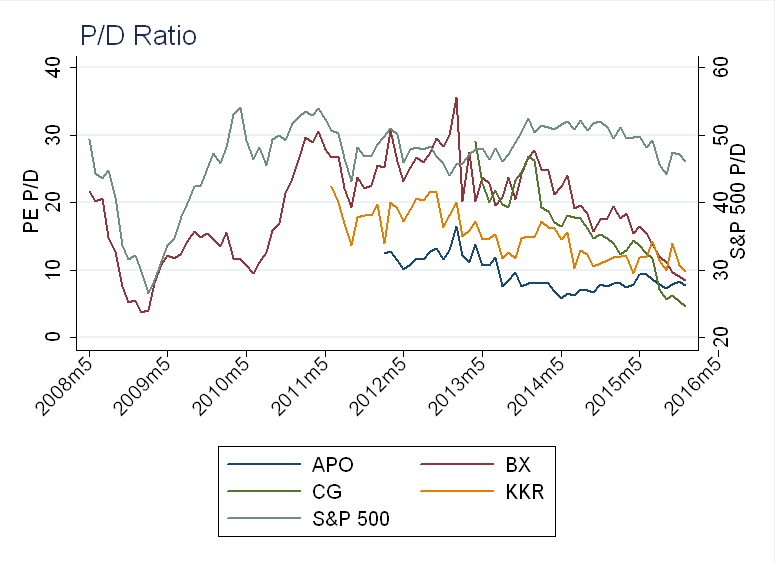
We can see that other companies IPO when BX is near peak valuation, lending creditability to the explanation above about high perceived valuations. After 2013, we see a steady decline in \(P/D\) for private equity companies, while the S&P 500’s stays flat over the same period.
Let’s break down the components of \(P/D\) for BX:
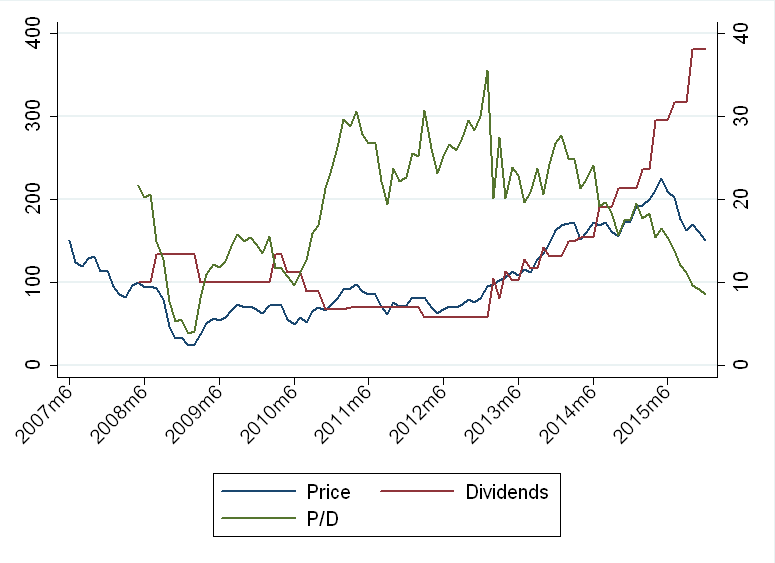
We can see that \(P/D\) is declining mainly because dividends are going up!
That being said, I’m not sure \(P/D\) is the best way to think about valuing a private equity company. Private equity firms buy struggling companies, sell companies with high valuations, and hold companies with low valuations (hoping to increase their valuation through better management, cutting costs, etc.). Given that they are periodically selling their most valuable assets, the value of the parent goes down, but dividends go up, as the proceeds are distributed to shareholders.
Another factor that complicates the analysis is the structure of the publicly traded shares. For example: KKR’s shares are listed through KKR & Co., which holds 30\% of the firm’s ownership (while the other 70\% is still held by the firms partners). Unlike most other publicly traded companies, these shareholders will never have a majority interest in the firm, so it’s hard to think about the value of voting rights.
Future Work
These are just some motivating examples - private equity companies are difficult to value, and I would need to better understand how they make investments and how they improve the companies they purchase before going any further. Two articles on the topic are:
1) The Cash Flow, Return and Risk Characteristics of Private Equity, Ljungqvist and Richardson (2003)
2) The Operational Consequences of Private Equity Buyouts:
Evidence from the Restaurant Industry, Bernstein and Sheen (2013)
Fun Fact
Axes is the only English word that is the plural of 3 different singular nouns: ax, axe and axis