Op-Ed Review: Bull Market Blues, by Paul Krugman (Updated 7/18/2016)
Paul Krugman is an Op-Ed columnist for the New York Times, the original article can be found here.
Update (7/18/2016)
Thinking more about what Krugman wrote, I’m not confident I was presenting the right data to evaluate his claims. First, consider the total market capitalization of all firms traded on the three major exchanges (NYSE, AMEX and Nasdaq) as a fraction of GDP (Source: FRED):
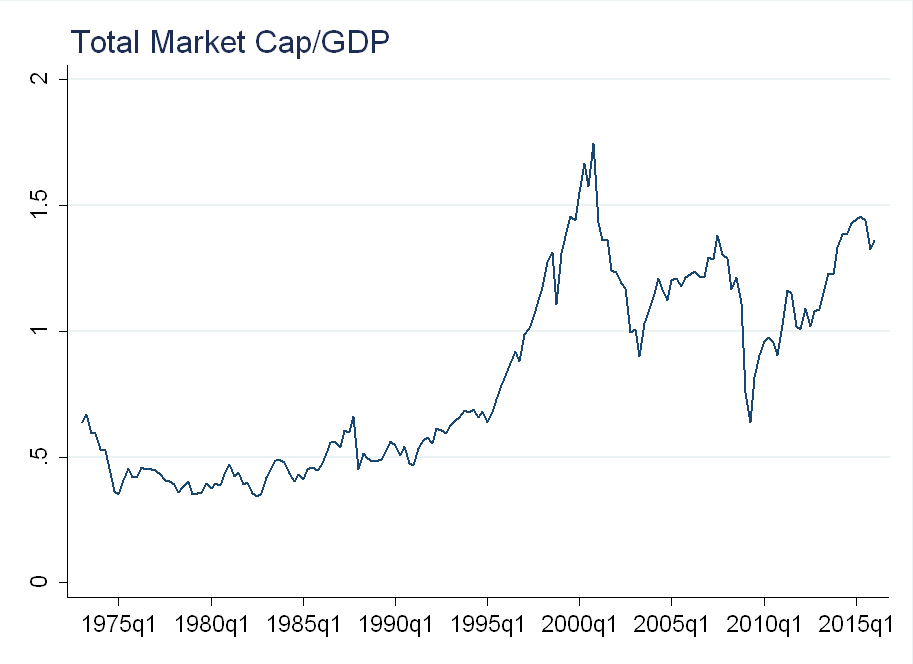 This is close to an all time high, lending credibility to Krugman’s claim that there are not many other investment opportunities, and as a result, stock holdings are increasing.
Now, consider the total operating profitability (defined as total revenue - cost of goods sold) as a fraction of GDP (I’ve smoothed the series, taking a trailing 4 quarter moving average):
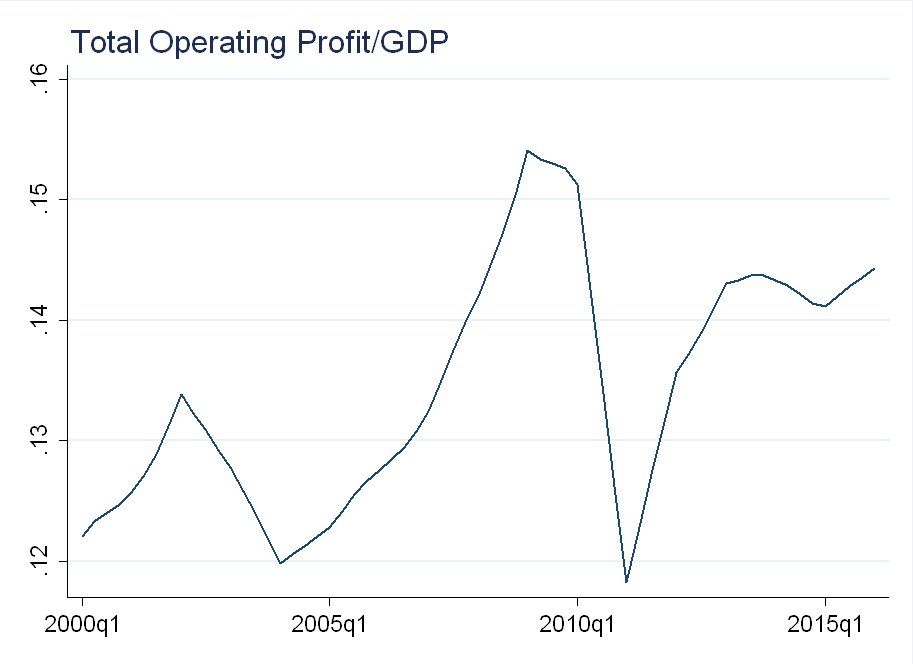
This is also at an all time high, lending credibility to Krugman’s claim about a profitability boom.
Finally, dividends might not be the best measure of fundamentals, as payout rates may be changing over time. Below I plot data from Robert Shiller on the price-to-earnings ratio (P/E) for the S&P 500 index:
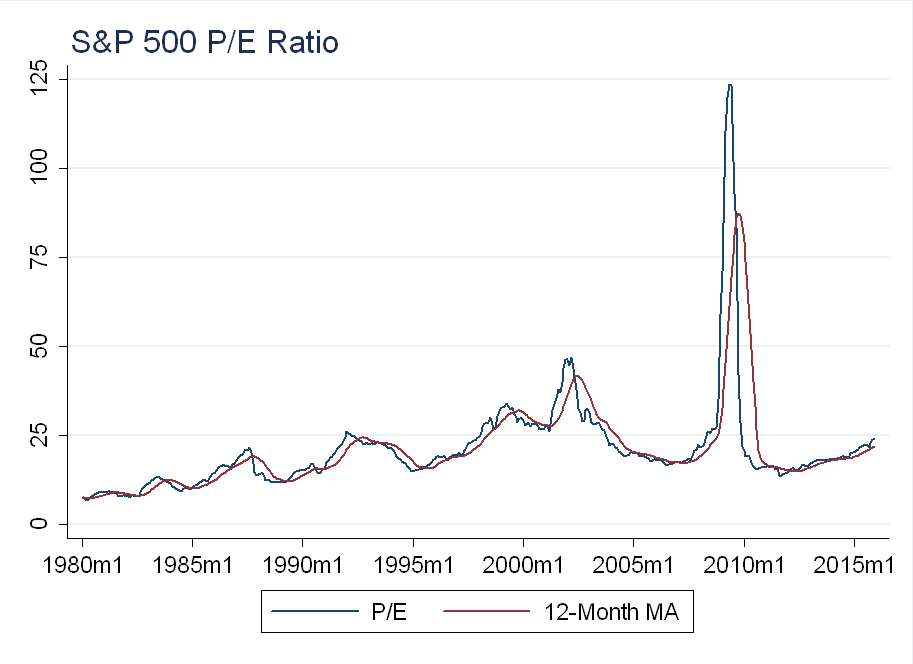
Over the past several years, the P/E ratio has been increasing, suggesting an increase in valuations.
Given these facts, I’ve changed my conclusion. I think Krugman is trying to say the stock market is “overvalued”, which is why we shouldn’t be too enthusiastic about high stock prices, and to a degree, he’s right. Evidence of this can be seen in:
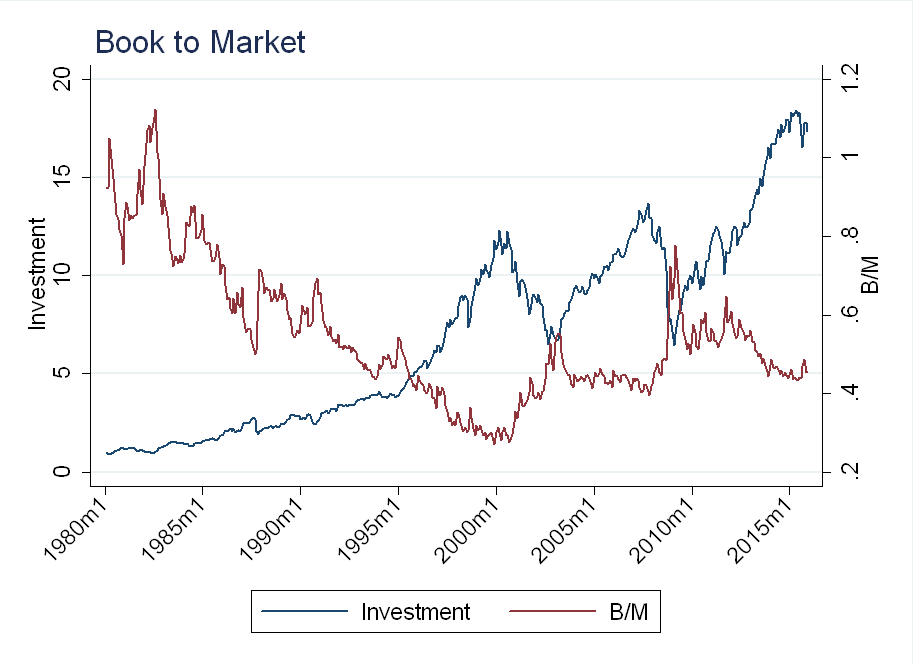
1) The Book-to-Market ratio (see figure below) is low when valuations are high, and has been steadily declining over the past several years.
2) The P/E ratio is high when valuations are high, this has been steadily increasing over the past several years.
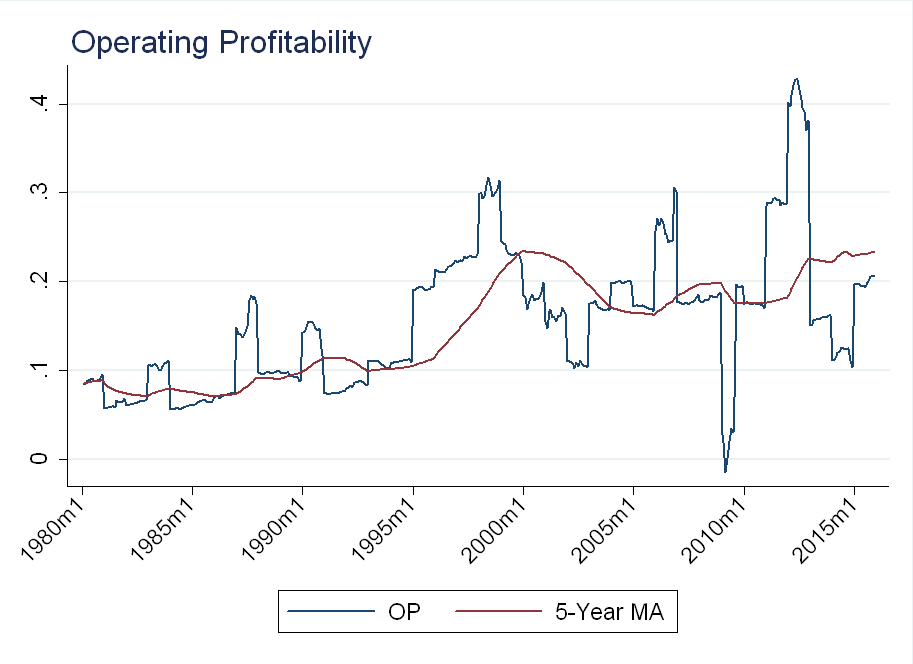
4) Operating profitability (relative to book value of equity) has decreased (see figure below), but operating profitability has increased relative to GDP.
4) The total value of stocks relative to GDP is near an all time high
Krugman’s Claims
Krugman starts off saying we shouldn’t pay too much attention to the stock market because it is susceptible to, “popular delusions and the madness of crowds”. He goes further, saying that the stock market is not a reflection of success in the general economy for three reasons:
1) Stock prices reflect corporate profits, not individual incomes
2) Prices reflect the availability of other investment opportunities
3) There is a weak relationship between stock prices and real investment
Below I look at the data to dig deeper into some of Krugman’s claims.
The Data
The data is from CRSP and Compustat. I restricted the sample to ordinary common shares traded on the three major exchanges: NYSE, Nasdaq and NYSE MKT (formerly American Stock Exchange). Fundamental data is from June of the previous year, to prevent look-ahead bias (this is also in line with Fama & French, see here).
Book value of equity = stockholders equity + tax deferred assets - preferred stock. To be included in the sample, I require that stockholders equity be non-missing
Operating profitability = (revenue - cost of goods sold - interest expense - SG&A expense)/book value of equity. To be included in the sample, I require that at least one of: cost of goods solds, interest expense or SG&A to be non-missing (in line with Novy-Marx).
Dividend yield is computed as returns - ex-dividend returns. Dividends are smoothed using the same procedure as Robert Shiller (see his website ). Dividend growth is computed as: \(log(d_t/d_{t-1})\)
To prevent selection bias of higher quality firms showing up in Compustat (where I get the operating profitability and book value data), the returns are computed using a value-weighted average of all firms. Value weights are computed at the beginning of each month, using the lag of market cap (price \(\times\) shares outstanding) to prevent a look-ahead bias.
The Facts
When Krugman mentions “popular delusions and the madness of crowds”, I assume he means “bubbles.” As a first pass, let’s check for evidence of a bubble by relating prices to fundamentals. Let \(P\) be the price, and \(D\) be the dividends:
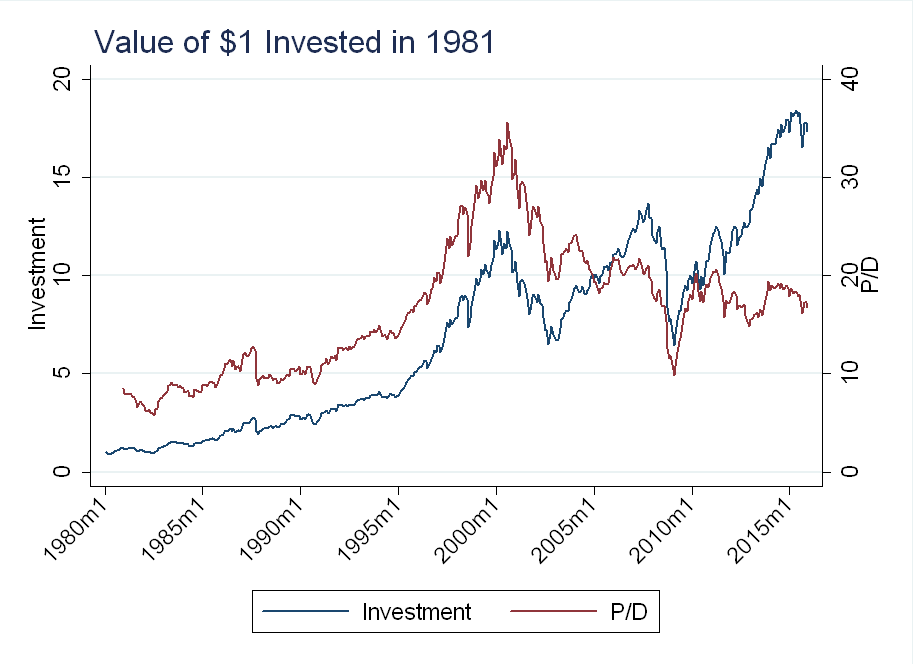
You can see that there were large changes in the P/D ratio around the technology bubble in the late 1990’s and around the financial crisis in 2008 (although I’ve mentioned in previous blog posts why this is not definitive evidence of a bubble), but is has been relatively stable since then.
To make this more clear, I added the 5-year moving average of the P/D ratio to the monthly P/D ratio series:
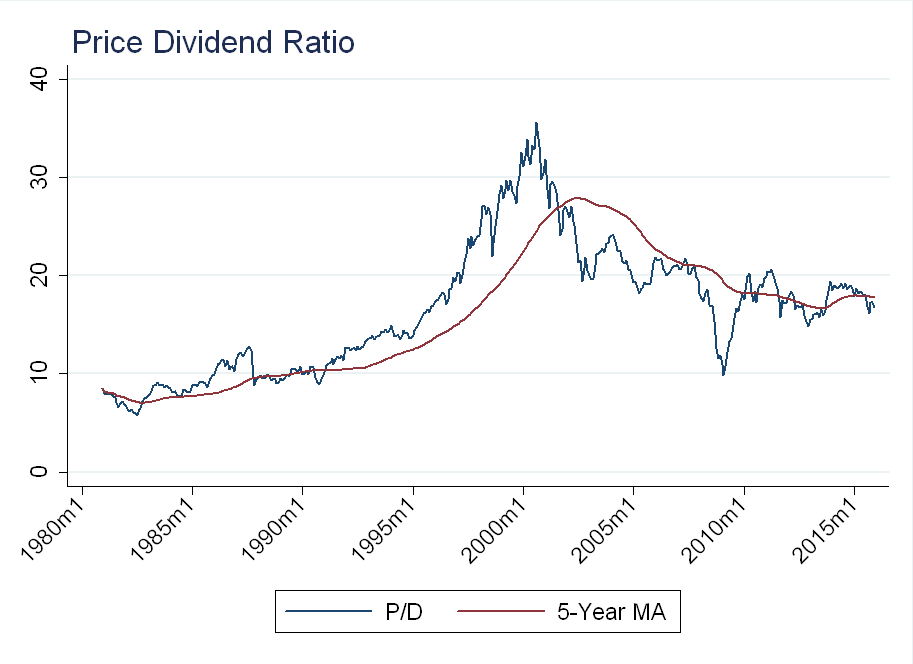
Currently, P/D is not very far from it’s long-term average. The point I’m trying to make here is that the recent rise in prices has been accompanied by comparable increases in fundamentals (dividends), so we can’t just write it off as a “bubble”.
As a robustness check, consider another measure of value: book value of equity/market value of equity. Again, it has been relatively stable as of late:
Now, what of Krugman’s profitability boom? Below I superimpose a value-weighted average of operating profitability over the index performance. Note, the series is “jumpy” because it is only updated annually, while the return data is computed monthly:
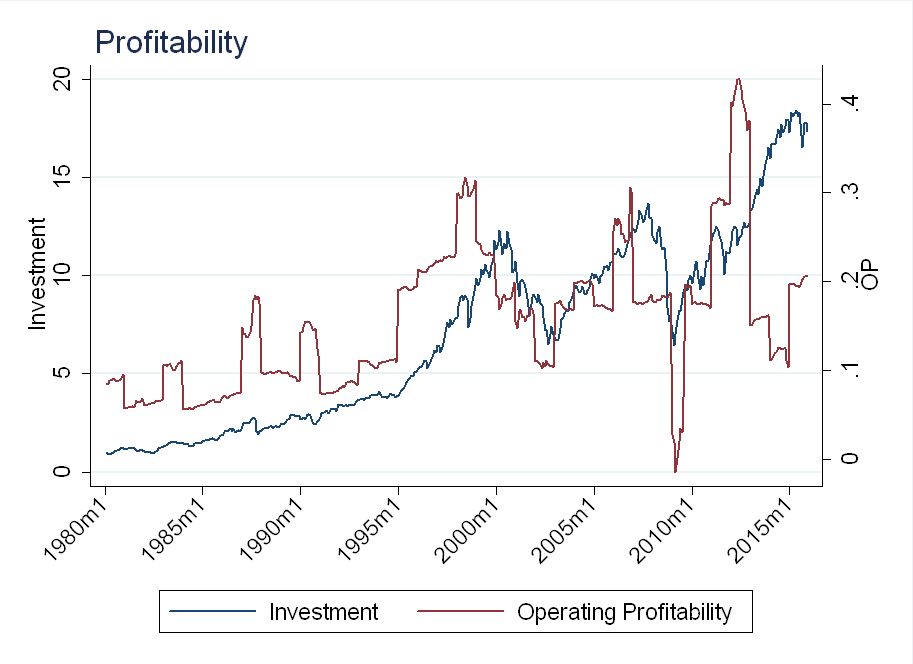
As you can see, profitability peaked around 2011-2012, and although it has increased over the past year, it is still below the long-term average:
“Other Investment Opportunities”
Krugman claims that one of the reasons the stock market has done so well is that stock prices depend on, “what other options [investors] have for converting money today into income tomorrow”. His evidence is that Treasury bill yields are very low, so people are willing to, “pay a lot for future income.” My interpretation is that he believes the discount rate is low.
Let \(r\) be the discount rate, and \(g\) be the dividend growth rate. To simplify things, think of a Gordon Growth Model:
\begin{equation}
\frac{P}{D}=\frac{1}{r-g}
\end{equation}
If \(r\) is low, and \(g\) stays the same, then we would expect P/D to be high (note: this is not totally correct, \(r\) is actually a function of \(g\), but I am jus t looking for intuition here).
Below I’ve plotted P/D and dividend growth:
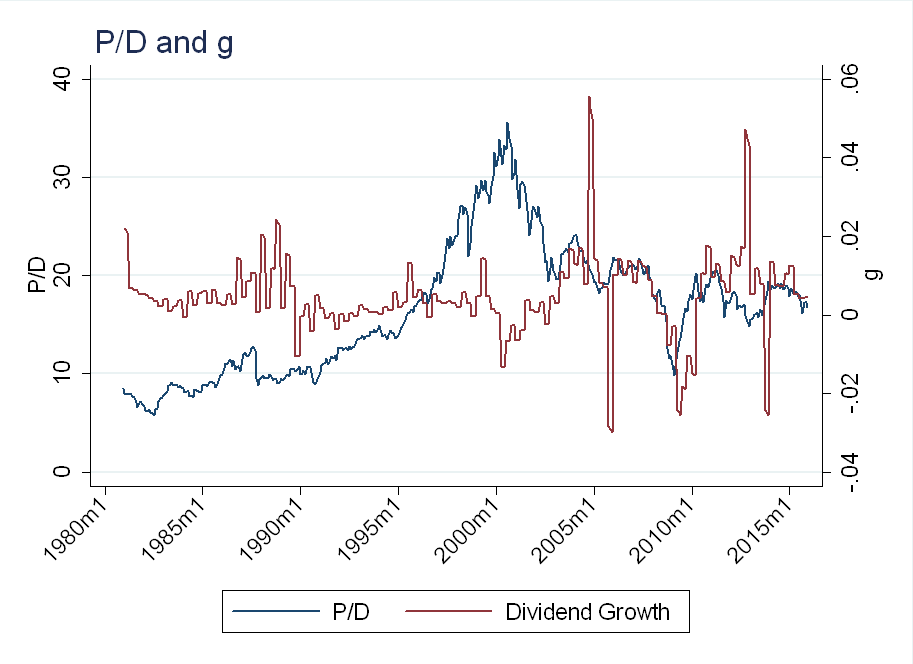
Average dividend growth has not changed that much over the past few years, and neither have P/D ratios. If \(r\) is so low, and \(g\) is unchanged, we would expect \(P/D\) to go up. Again, this is not formal analysis, just looking for some evidence that suggests Krugman’s claim of low \(r\) might be true.
Conclusion
In economics, a lot of “facts” seem to be common knowledge, and this is expressed through broad claims, like Krugman’s profitability boom (which actually happened between 2011 and 2012). I would be more willing to believe these claims if they were accompanied by data, code, etc. so that anyone could easily replicate the results. Given that this isn’t even the standard for all academic articles, however, I doubt this will ever be the standard for economic journalism.