The Power of Profitability
In, “The Little Book That Beats The Market” (2006), Joel Greenblatt screens for stocks using earnings yield and return on capital. This post describes the performance of a mechanical strategy based on these criteria. After writing the post, I found, “The Other Side of Value: The Gross Profitability Premium” (Novy-Marx, 2012), which presents similar ideas in a more rigorous way.
Definitions
Earnings yield is defined as earnings before interest and taxes (EBIT)/enterprise value (EV). Using data from Compustat, I compute: \begin{equation} EBIT = Revenue - Operating Expenses \end{equation} \begin{equation} EV= Market Cap. + Debt + Preferred Stock - Cash \end{equation} Return on capital is defined as EBIT/net fixed assets (NA). Again, using Compustat data: \begin{equation} NA=Total Assets - Depreciation + Net Working Capital (NWC) \end{equation} \begin{equation} NWC=Current Assets - Current Liabilities \end{equation} Greenblatt’s return on capital is similar to Novy-Marx’s profitability, defined as: \begin{equation} Profitability=\frac{Revenue - Cost of Goods Sold}{Total Assets} \end{equation}
The Data
The returns data are from CRSP and the financial data are from Compustat. I applied the following filters before forming portfolios:
1) Only include ordinary common stock for companies incorporated inside the U.S. traded on a major exchange - NYSE, AMEX and Nasdaq
2) Remove stocks in the bottom 10% of market capitalization
3) Only include stocks that are in both CRSP and Compustat with a primary link type (LC or LU, see CRSP’s guide here)
4) For the portfolio formation period, require non-missing revenue, operating expenses and market capitalization
To prevent a look-ahead bias, I use accounting data with a minimum 6-month lag. For example, if a company has fiscal year end in December, data from 2010 Q2, will be used to form portfolios at the end of December 2010. I update the financial information once a year.
Portfolio Formation
The portfolio formation is very similar to the
6 Portfolios formed on Size and Book-to-Market. Using NYSE stocks, I calculate the median earnings yield (EY), as well as the 30th and 70th percentiles of return on equity(ROE). I use these breakpoints to form 6 value-weighted portfolios:
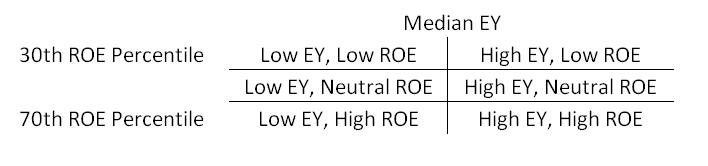
Portfolios are rebalanced at the end of every month.
Performance
Compare the value of a dollar invested in the low EY & low ROE firms to the high EY & high ROE firms (in the table above, this corresponds to the top left and bottom right portfolios):
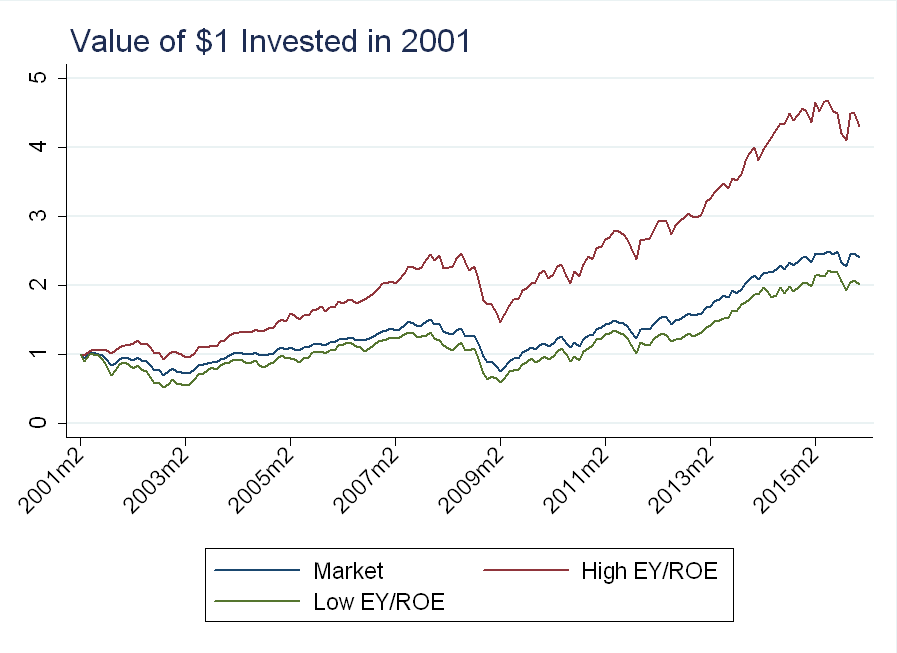
The market portfolio is the value-weighted average of all stocks that remained after applying the filters described above.
The high EY/ROE portfolio cumulatively returns about double the market over the past 15 years. To see if EY or ROE is driving the results, I plot all 6 portfolios, color-coded by above median EY (blue) and below median EY (red):
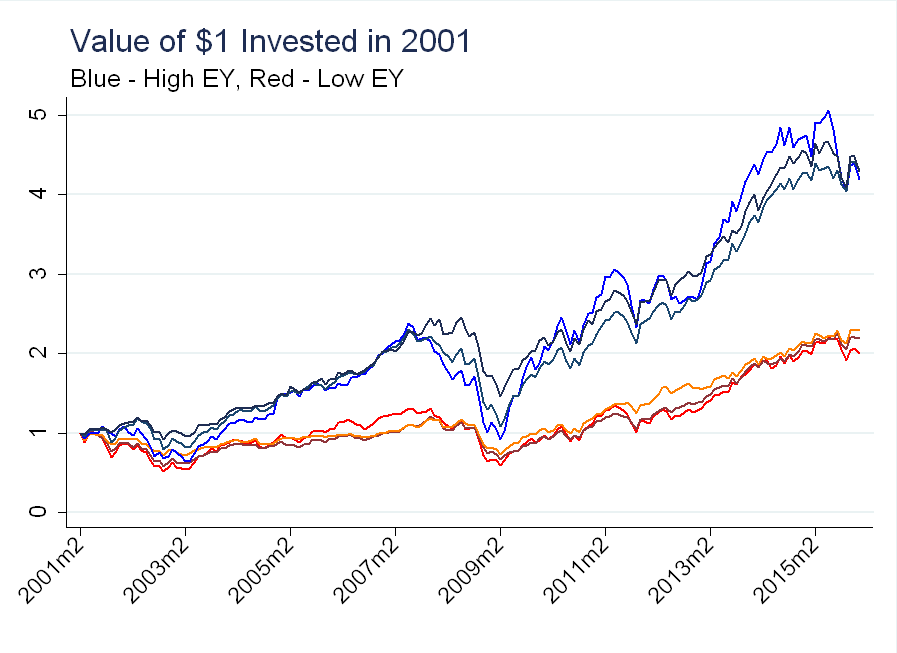
Once we sort on EY, sorting on ROE has little effect.
Asset Pricing Factor
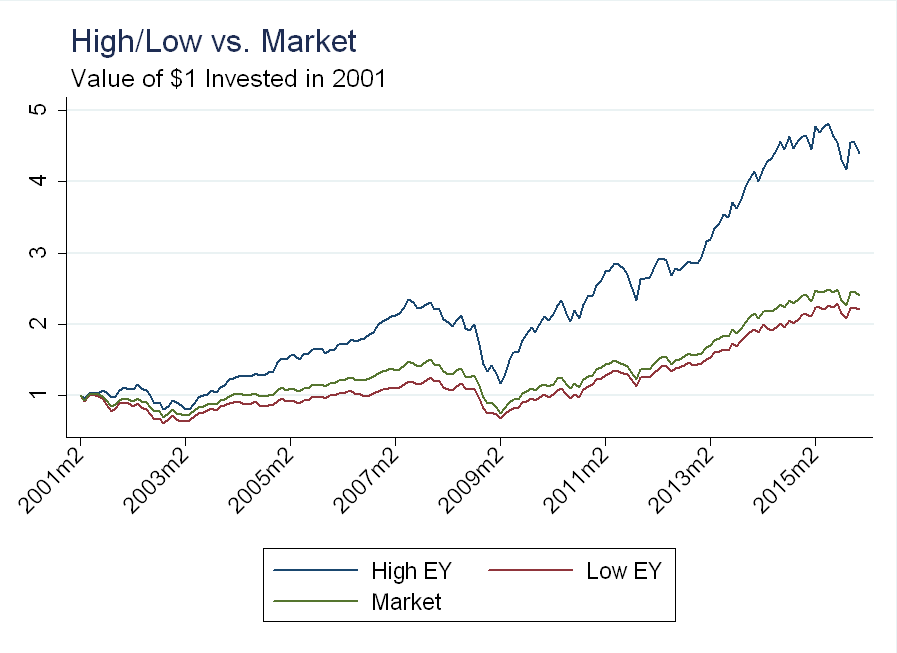
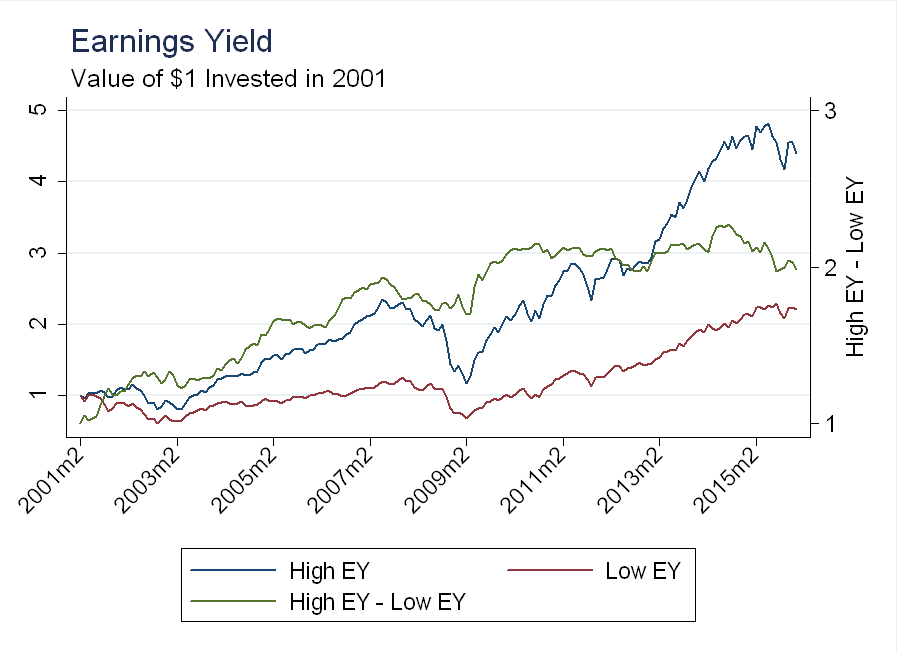
Similar to Fama and French, I construct an Earnings Yield factor. The long side is an equal-weighted average of the 3 high EY portfolios, while the short side is an equal-weighted average of the 3 low EY portfolios. The long side beats the market, while the short side under-performs:
The factor is the long side minus the short side:
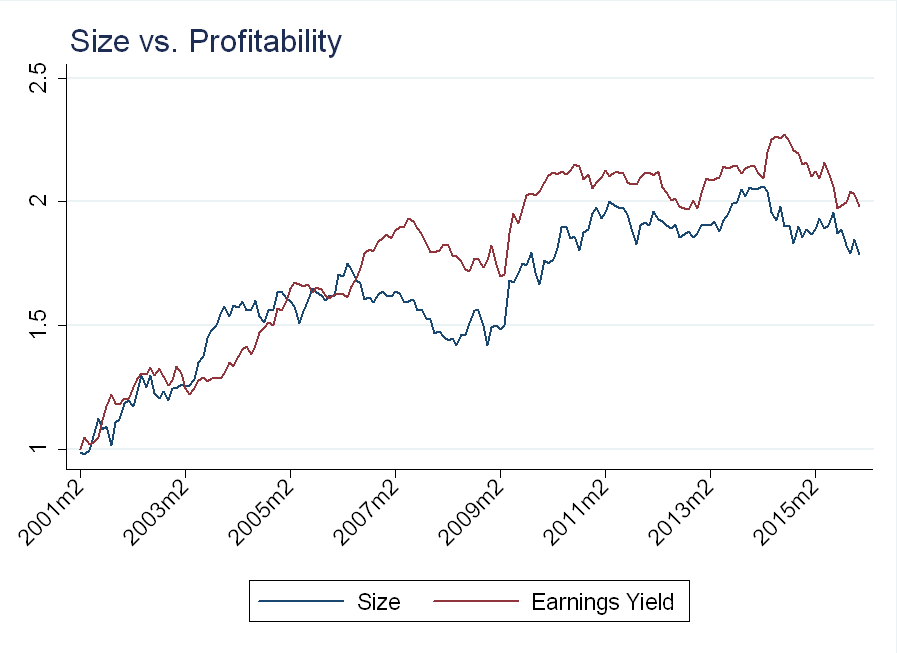
I wanted to see if the EY factor contains information not in the Size or Value factors (see
here for my factor construction).
From 2001-2005, EY is highly correlated with size. The correlation breaks down during the financial crisis, but resumes in 2009:
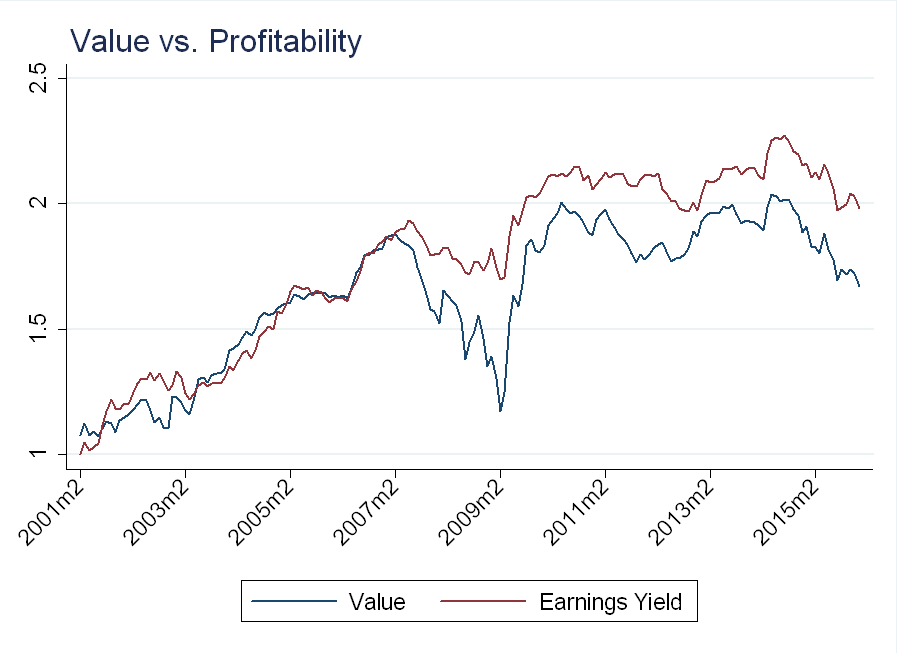
We see the same pattern with the value factor:
To confirm, I regress returns for the high EY and high ROE portfolios on the market, SMB, and HML. The “top 30% return on equity” portfolio is an equal weighted average of the low EY/high ROE and high EY/high ROE portfolios:
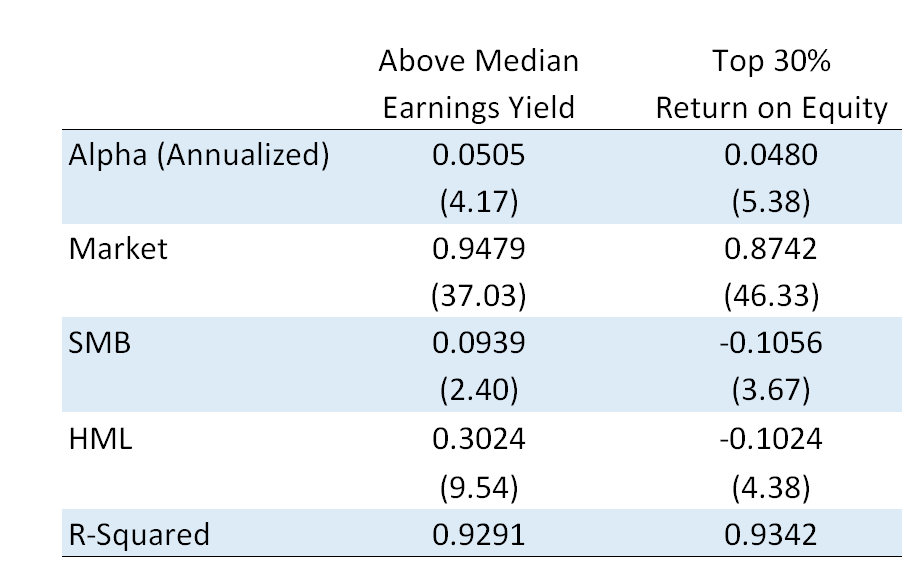
I multiply by 12 to annualize the alphas. While much of the variation in these portfolios is explained by the 3-factor model (\(R^2\) of over 90%), the alphas are large and statistically significant. The alpha comes from avoiding the dip in the financial crisis, which is shared by the size and value factors.
Conclusion
Profitability is powerful - we can improve the performance of size and value by sorting on earnings yield. I, however, am 4 years too late, as Novy-Marx makes the exact same point in the abstract of his paper, “Controlling for profitability also dramatically increases the performance of value strategies, especially among the largest, most liquid stocks.” I’m also decades behind Greenblatt, “whose investment firm has averaged 40% annual returns for over twenty years…” Not surprisingly, his best ideas don’t make the book, as an average market return of 6% per year + an alpha of 4% per year (regressing the high EY portfolio on the market) only gets us to 10%, well below Greenblatt’s 40%!