Skewness and Expected Returns
Intuition
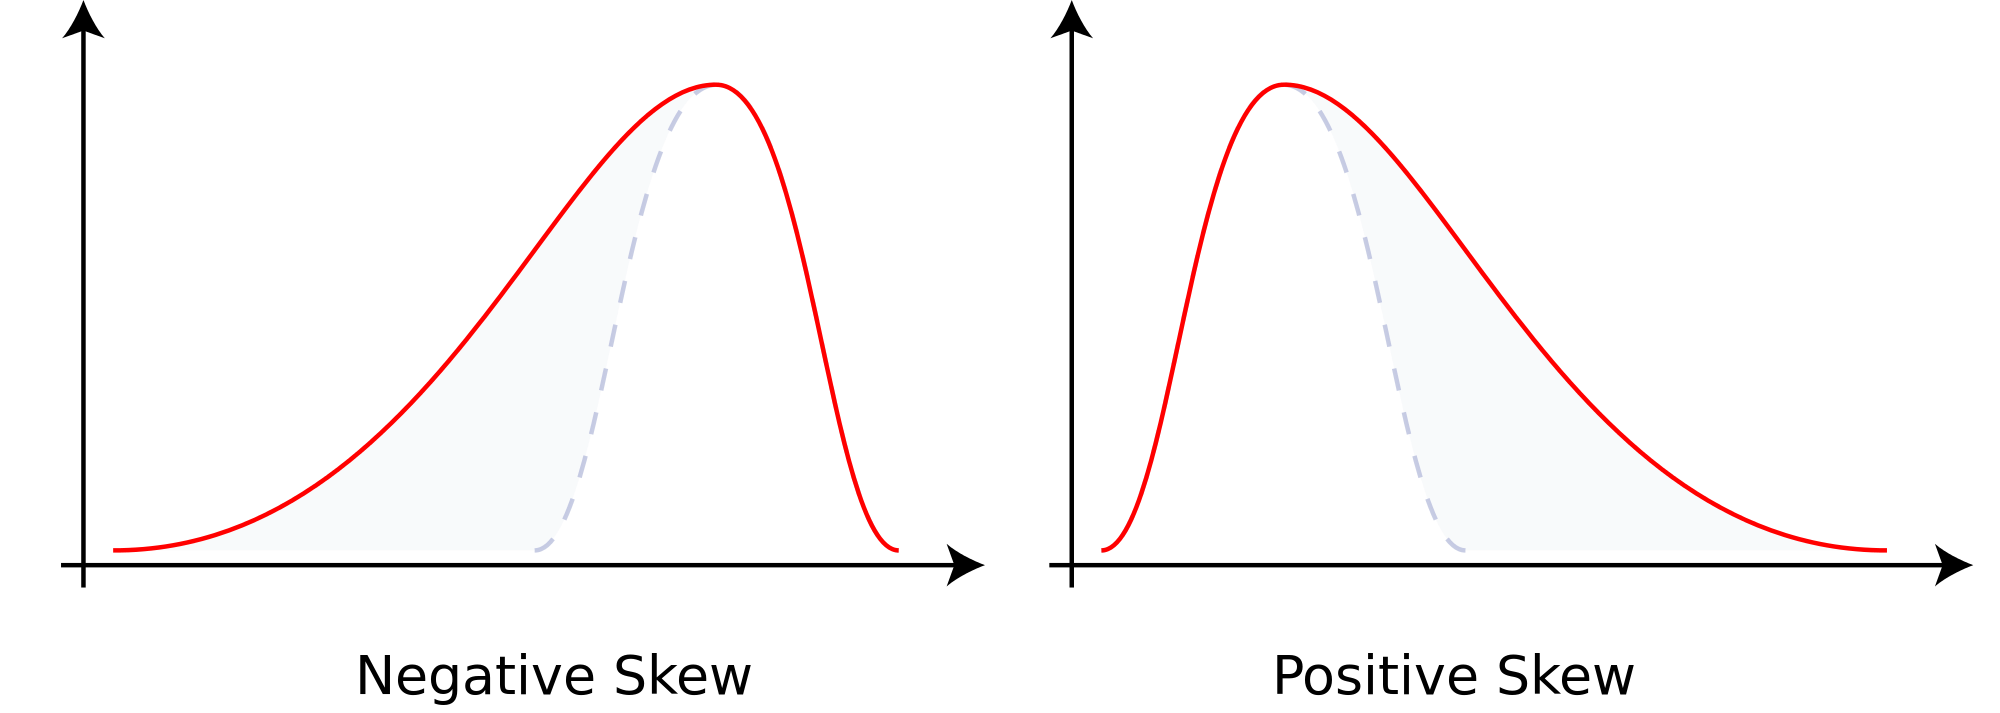
From Harvey and Siddique (2000): “[Risk averse] investors should prefer portfolios that are [positive]-skewed to portfolios that are [negative]-skewed.” The graphic below shows the difference - negative skew entails a long left tail, and a mean below the median:
.svg/2000px-Negative_and_positive_skew_diagrams_(English).svg.png)
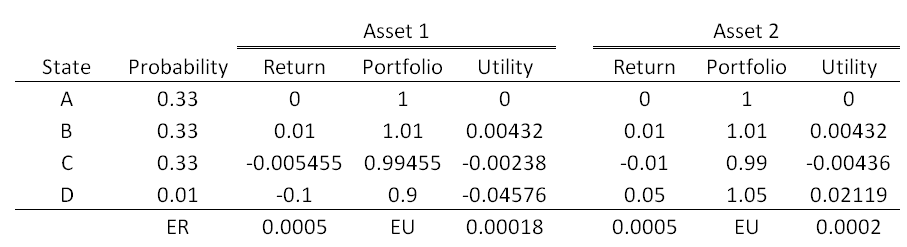
The following example, with a $1 portfolio and \(u(c_t)=log(c_t)\), supports this claim - assets 1 and 2 have the same expected return, but 1 has left skewed returns and 2 has right skewed returns. The investor gets higher expected utility from asset 2:
Skewness and Expected Returns
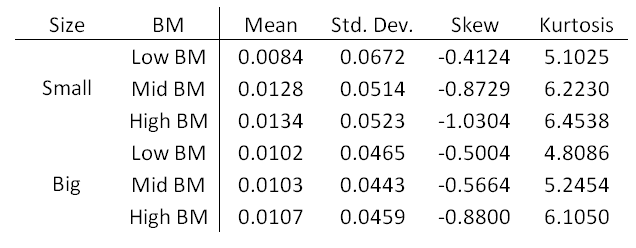
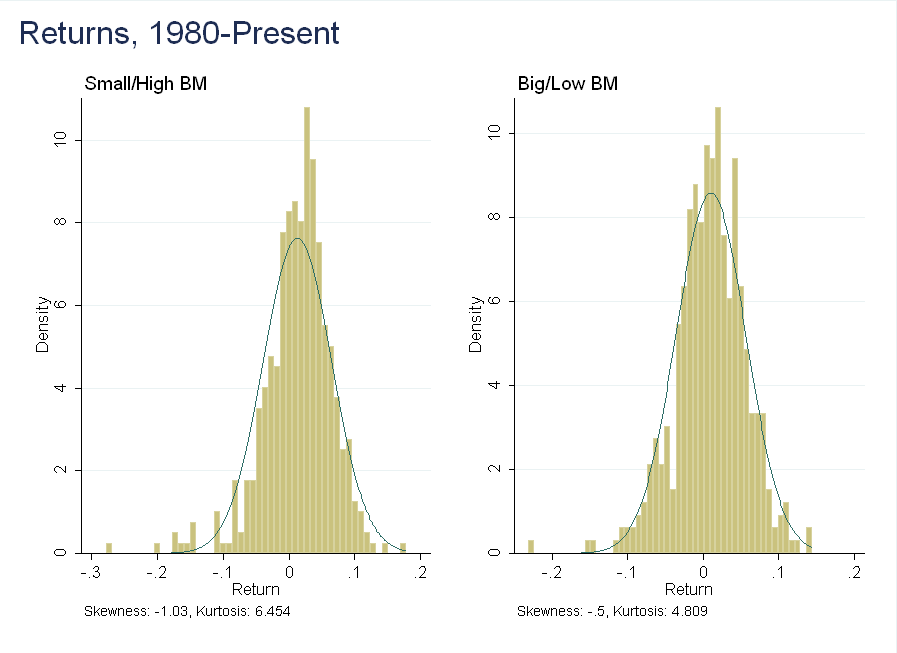
Let’s look at the two families of 2\(\times\)3 sorted portfolios using Ken French’s data from 1980-present: Size/Book-to-Market (BM) and Size/Momentum (Prior). For reference, the CRSP value-weighted index had a skewness of -0.7638 over the same period.
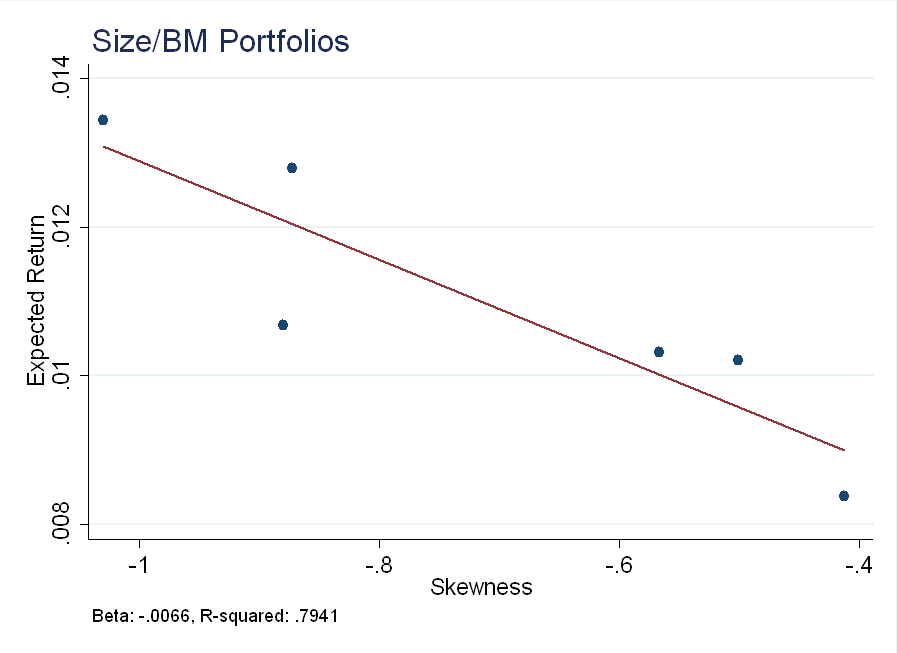
The small/high BM portfolio has the highest expected returns - it also has the largest skewness (in absolute value).
The same point is conveyed by histograms (the fitted normal has the same mean and variance as the underlying data). The small/high BM portfolio has a heavy left tail - mass above the blue line to the left of the mean - not present in the big/low BM portfolio:
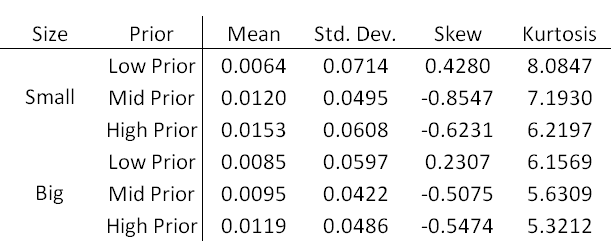
The relationship is not as strong in the size/momentum portfolios (low prior return = low momentum), but it is still present.
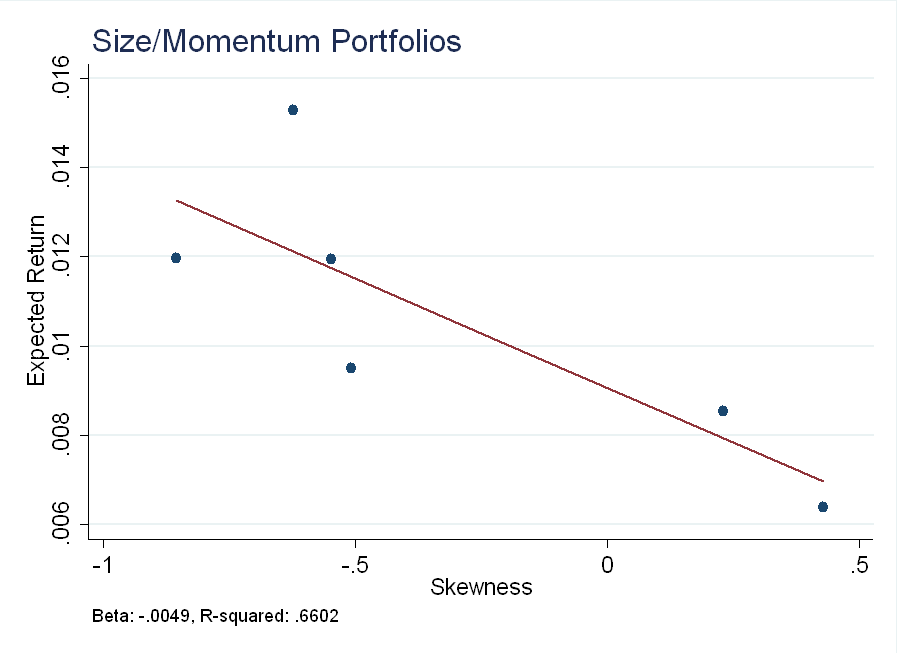
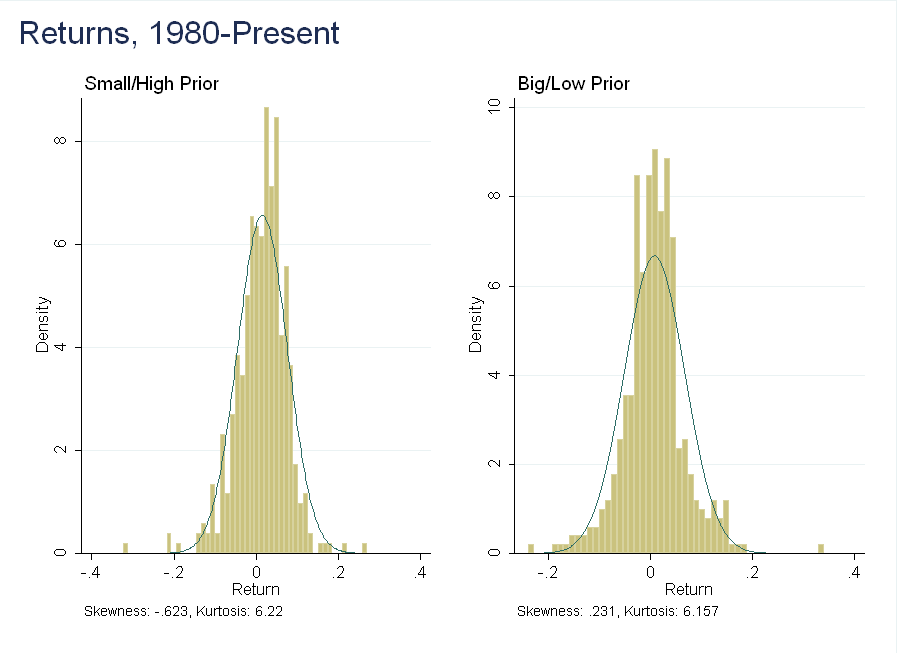
Here, the histogram shows a slightly different picture than the summary statistics - in the small/high prior portfolio, there are a few extreme events (momentum crashes) not present in the big/low prior portfolio. Rare disaster risk could weaken the relationship between skewness and expected returns in these portfolios.
Conclusion
To a first order, the intuition is correct - the more negatively skewed portfolios have higher expected returns.