Index Inclusion vs. Passive Ownership
I have been updating my paper on passive ownership to incorporate comments from my recent Kellogg bag lunch (a copy of the presentation can be found here). In the paper, I document a decrease in stock price informativeness over the last thirty years. Using two natural experiments, I show that passive ownership is an important cause of this decline. I also find empirical evidence that passive investors gather less information about stock-specific risks, suggesting a mechanism for the causal results. In a companion paper (update coming next week!), I develop a model where this information-gathering mechanism arises endogenously. The introduction of an Exchange Traded Fund (ETF) in the model leads fewer investors to become informed, and the remaining informed investors to learn more about systematic risk and less about stock-specific risks.
One concern is that the results from the natural experiments are driven by index inclusion effects (see e.g. What Drives the S&P 500 Inclusion Effect? An Analytical Survey), rather than the increase in passive ownership associated with index inclusion. For example, the general consensus is that when a firm is added to an index, its stock returns become more correlated with the stock returns of other firms in that index. If this changed the distribution of stock returns on non-earnings announcement dates, it could affect my meausre of pre-earnings price informativeness.
In this blog post, I am going to (1) Describe one of the price informativeness measures in my paper (2) Describe the natural experiments, and measure index inclusion effects (3) Relate these index inclusion effects to my results.
Set Up
My paper proposes three ways to measure pre-earnings price informativeness: (1) Trading volume in the month before an earnings announcement (2) the pre-earnings drift (3) the share of total annual volatility that occurs on earnings days. In this post, I am going to be focusing on this third measure, because I think it is the most likely to be influenced by index inclusion effects.
The motivation for this third measure is as follows: If the total amount of information is not changing over time, but prices become less informative before earnings announcements, we would expect there to be (1) relatively larger returns on earnings days and (2) relatively smaller returns on all other days. I quantify this using the share of total annual volatility occurring on earnings dates. Specifically, define the quadratic variation share (QVS) for firm \(i\) in year \(t\) as: \begin{equation}\label{eq:qvs} QVS_{i,t}=\sum\limits_{\tau=1}^4 r_{i,\tau}^2/\sum\limits_{j=1}^{252} r_{i,j}^2 \end{equation} where \(r\) denotes a market-adjusted daily return (the stock return minus the market return). The numerator is the sum of squared returns on the 4 quarterly earnings days in year \(t\), while the denominator is the sum of squared returns for all days in year \(t\). If relatively more information is being learned and incorporated into prices on earnings dates i.e. prices have become less informative before earnings announcements, we would expect larger values of \(QVS\).
Earnings days make up roughly 1.6% of trading days, so values of \(QVS_{i,t}\) larger than 0.016 imply that earnings days account for a disproportionately large share of total volatility. This figure plots coefficients from a regression of \(QVS\) on a set of year dummy variables:
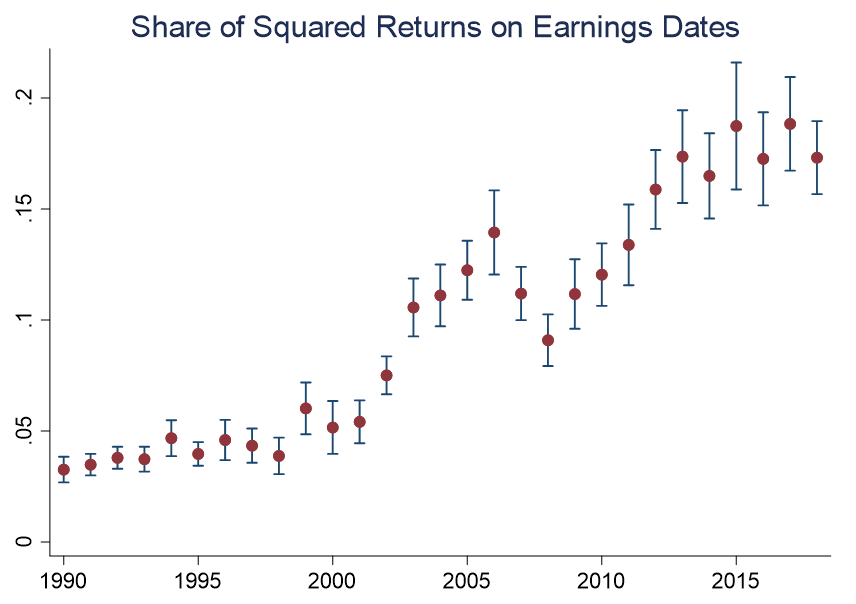 Average \(QVS\) increased from 3.0% in 1990 to almost 16% in 2018. The Appendix of the paper shows that the increase in \(QVS\) was due to a simultaneous increase in the numerator (more volatility on earnings days) and a decrease in the denominator (less volatility on all other days).
Here is the (value-weighted) distribution of \(QVS\) for a few selected years:
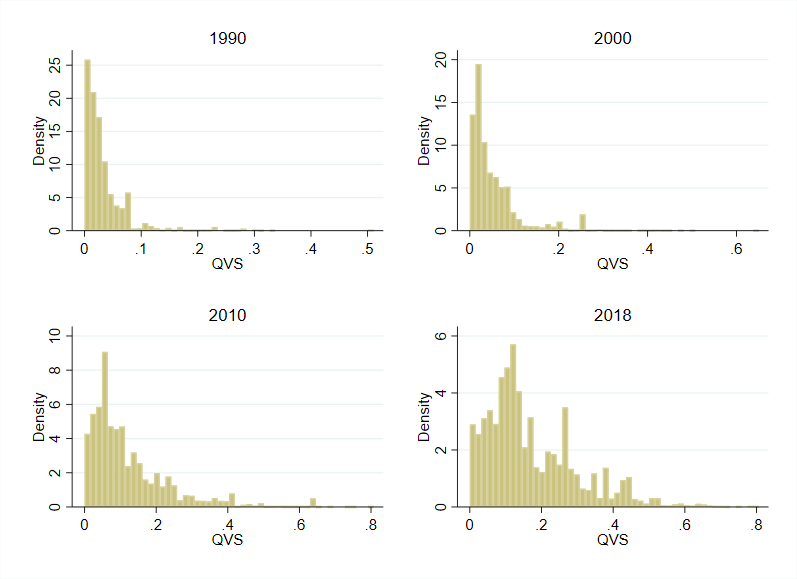 As time has gone on, the distribution has spread out more, with an especially long right tail – note the change of scale, especially in 2010 and 2018.
I find that increases in passive ownership are correlated with increases in \(QVS\). In the paper, passive ownership is defined as the percent of shares outsanding which are owned by index mutual funds and ETFs. This table shows a regression of \(QVS\) on the change in passive ownership, a set of firm level controls/fixed effects, and a set of year/quarter fixed effects:
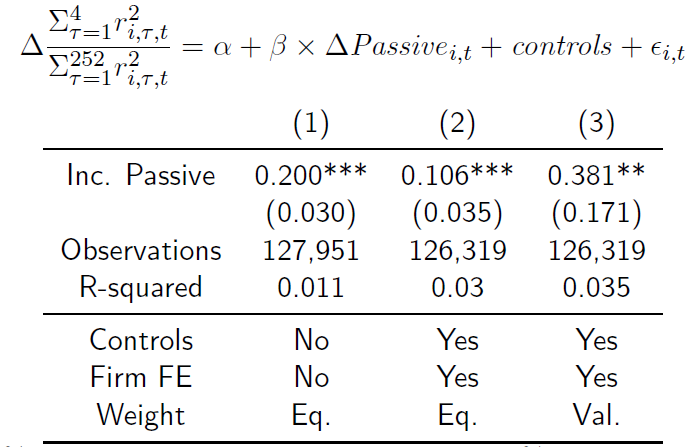 These estimates imply that a 10% increase in passive ownership would explain 10-20% of the average decline in \(QVS\) we’ve observed over the past 30 years. For refrence, passive funds now own over 15% of the US stock market! For firms in the 95th percentile of passive ownership, this number can now be as high as 30%. In addition, this definition may understate the true size of passive ownership, as there has been a rise in closet indexing over the same time period – so there may be passive owners who still identify themselves as active funds.
S&P 500 Index Addition
When originally writing the paper, I was concerned that the reduced-form results (last table in the previous subsection) were due to reverse causality: maybe passive ownership happened to increase the most in stocks that had the biggest decrease in price informativeness for other reasons. With this in mind, I wanted to identify increases in passive ownership which are plausibly uncorrelated with firm characteristics. I knew that the largest passive fund is SPY, which tracks the S&P 500 index. As a result, firms which get added to the S&P 500 index get a big increase in passive ownership, so let’s start by looking into that proccess.
Each year, a committee from Standard & Poor’s selects firms to be added/removed from the S&P 500 index. For a firm to be added to the index, it has to meet criteria set out by S&P, including a sufficiently large market capitalization, a specific industry classification and financial health. Once a firm is added to the S&P 500 index, it experiences a large increase in passive ownership, as many index funds and ETFs buy the stock (SPY isn’t the only fund which tracks the index itself, and there are many sector ETFs which track subsets of the index).
With this in mind, I designed the following experiment: The treated group is going to be firms which are added to the index. The control group should be firms which reasonably could have been added to the index. Given the index inclusion criteria, I decided to select firms in the same industry, and of a similar size, which were not added to the index. As an additional check, I created a second control group, which is firms of a similar size/industry, but which are already in the index.
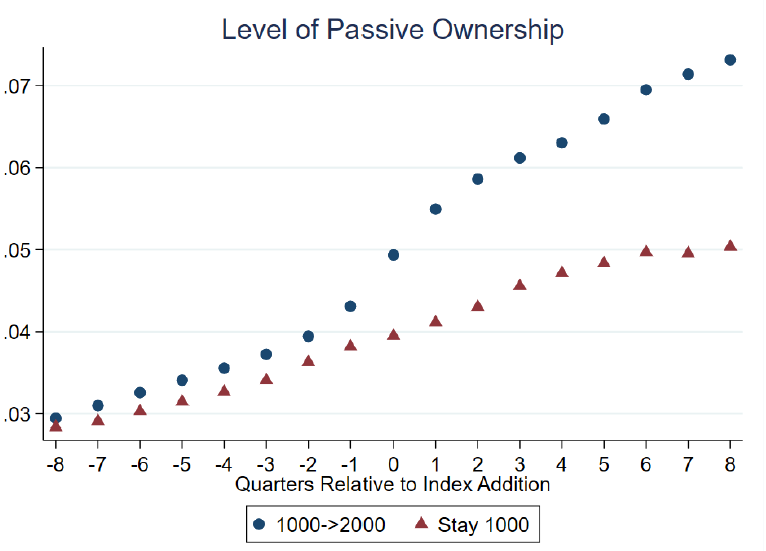
This plot shows the change in passive ownership around index addition for the treated group (blue circles), control group of firms out of the index (red diamonds) and control group of firms already in the index (green triangles):
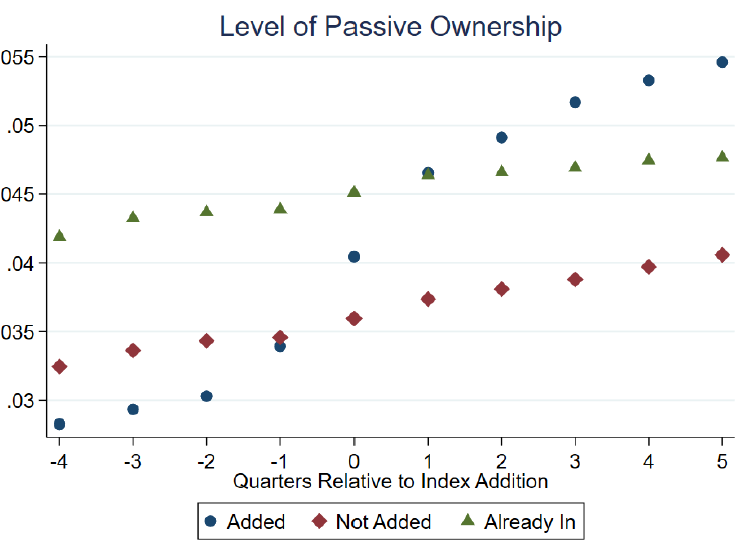 Unsurprisingly, the firms that are already in the index have higher passive ownership than those outside the index, and when a firm gets added to the index, there is an increase in passive ownership.
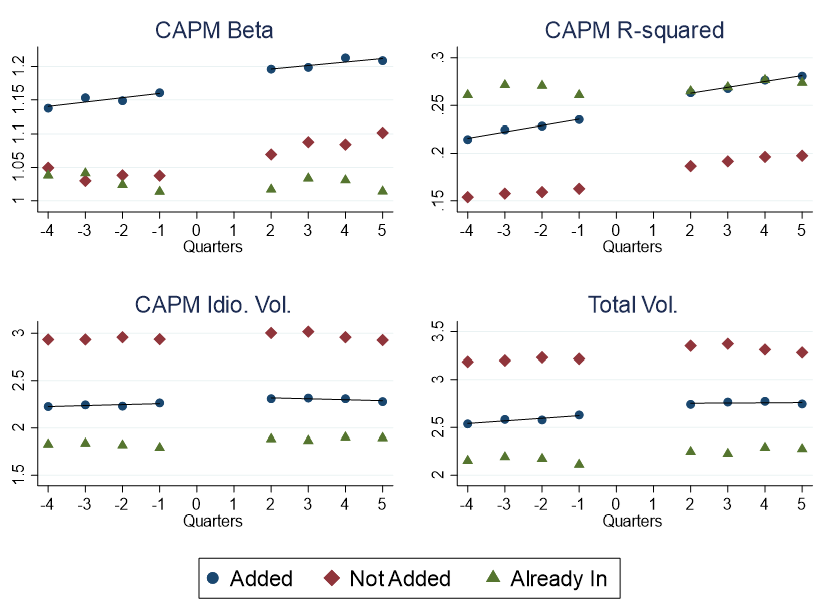
I find that when a firm is added to the S&P 500 index, its CAPM beta increases (marginally statistically significant) and its CAPM R-squared increases (statistically significant). There is no effect on the magnitude of CAPM residuals (i.e. idiosyncratic volatility), but there is an increase in total volatility (statistically significant). This last fact is consistent with Do ETFs increase volatility? and The sound of many funds rebalancing, where being a member of an ETF basket leads to additional volatility.
Russell 1000/2000 Rebalancing
The Russell 3000 contains approximately the 3000 largest stocks in the United States stock market. Each May, FTSE Russell selects the 1000 largest stocks by float (float is often very close to market capitalization) to be members of the Russell 1000, while it selects the next 2000 largest stocks by float to be members of the Russell 2000. Both of these indices are value-weighted, so moving from the 1000 to the 2000 significantly increases the share of passive ownership in a stock. The firm goes from being the smallest firm in an index of large firms, to the biggest firm in an index of small firms, increasing its relative weight by a factor of 10 (see e.g. Passive investors, not passive owners).
The increase in passive ownership corresponding to S&P 500 index addition is not a perfect natural experiment because firms are not added at random. Once added, firms receive increased attention, and added firms may start marketing their stock differently to institutional investors. The increase in passive ownership associated with the Russell reconstitution sidesteps many of these issues, as moving from the 1000 to the 2000 is based on a mechanical rule, rather than committee selection. Further, because the firm’s market capitalization shrunk, it is less likely to change the way the firm is marketing itself to institutions.
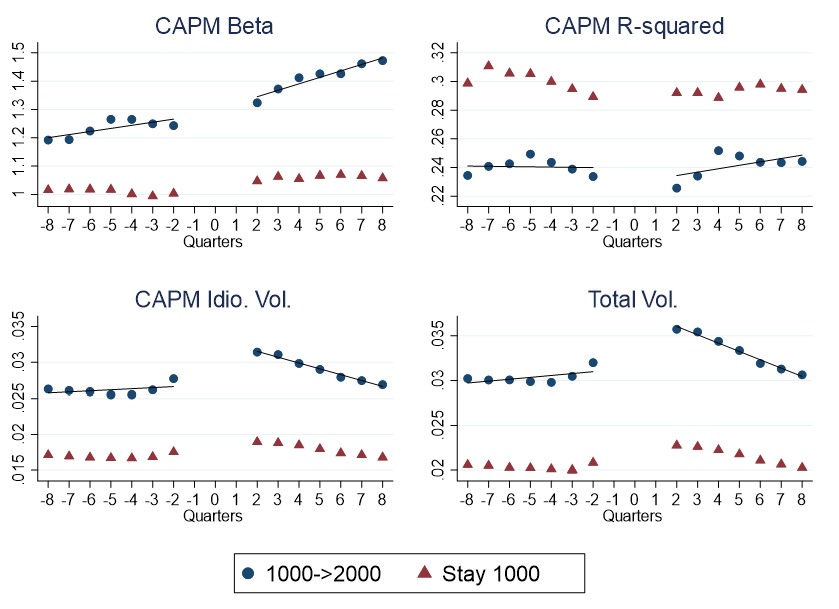
For this experiment, the treated firms are going to be those which switch from the Russell 1000 to the Russell 2000. For the control group, I identify firms which were in the Russell 1000 at the same time as the switching firms, had ranks between 900 and 1000, but did not switch to the Russell 2000. This figure shows the change in passive ownership for the switching firms (blue circles), and the control firms (red triangles):
 Consistent with the Russell reconstitution literature, there is an increase in passive ownership for the switching firms.
For the Russell experiment, firms which switch have a significant increase in CAPM beta, and a marginally significant decrease in CAPM R-squared. Switching firms also have significant increases in idiosyncratic volatility and total volatility. Firms which switch from the Russell 1000 to the 2000 are shrinking, so these last two facts are consistent with bad news usually being associated with increased volatility.
Implications
Here are the results from the S&P 500 experiment:
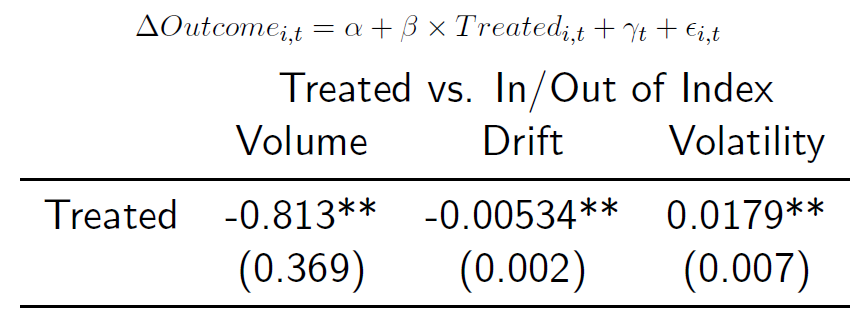 Firms which are added have a significant decrease in pre-earnings trading volume, a significant decrease in pre-earnings drift, and a significant increase in earnings day volatility (\(QVS\), last column).
Here are the results for the Russell experiment:
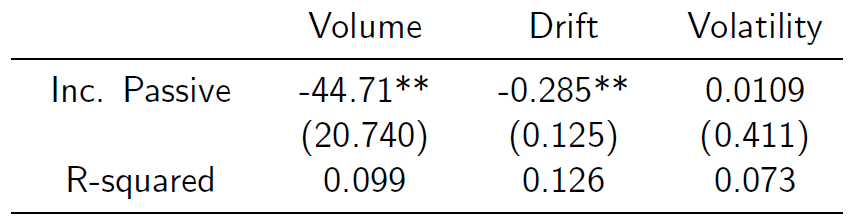 While the volume and drift results are consistent with my reduced-form estimates, the volatility (\(QVS\), last column) results are the right sign, but insignificant.
Why is this the case? The index inclusion effects are likely working against my results on the share of volatility on earnings days. If total volatility increases after index addition/rebalancing, the denominator of \(QVS\) should increase, and shrink \(QVS\). This may explain why the volatility results are insignificant for the Russell experiment: In the post period, treated firms had an increase in total volatility that was two times as large as the increase in total volatility for the corresponding firms in the S&P 500 experiment.
Wrap Up
In the real world, it’s hard to have a perfect labratory where we can change one variable of interest (e.g. passive ownership), and hold everything else fixed. In this instance, it appears that one of the confounding effects (index inclusion) was working against me, but I’m sure that even this is not the whole story! When firms get added to the S&P 500, there are changes outside of passive ownership and volatility: the firms may market themselves differently to instutitional investors, be under more scruinity (and thus will have a change in corporate governance), etc. This is one of the reasons why I want to further develop the theory behind the empirics: It will give me more testable predictions, that will (hopefully) help rule out these alternative explanations.