Who Owns Passive Ownership?
I have been updating my paper on the introduction of ETFs to incorporate comments from a recent bag lunch (a copy of the presentation can be found here). In the paper, I develop a model where rational agents decide to allocate attention to a systematic risk-factor that affects all assets, or idiosyncratic risk-factors that are specific to only one asset.
The systematic risk-factor, however, is less volatile than the stock-specific factors. This is central to a key trade-off in the model. Agents want to balance: (1) making more profits and (2) avoid holding a portfolio that seems too risky. Because stock-specific risk-factors are more volatile, there are more opportunities for profits trading stocks than trading in the ETF, but they are also riskier. Which of these forces dominate is governed by risk aversion: if agents are more risk averse, they prefer to hold diversified portfolios, while if they are closer to risk neutral, they prefer to make targeted bets on stock-specific risks.
In trying to link the effects of introducing ETFs to my paper on passive ownership, I had the following question: What is the analogue to passive ownership in the model? Uninformed investors are usually the agents who hold the ETF, while the informed investors are short the ETF. While this is a good start, I don’t think it’s the whole story. To tie things back to the data, in this post, I am going to examine which types of institutional investors actually holds ETFs.
Defining Passive Ownership
Let’s start with this definition from Investopedia. It says:
Active portfolio management focuses on outperforming the market in comparison to a specific benchmark such as the Standard & Poor’s 500 Index.
Passive portfolio management mimics the investment holdings of a particular index in order to achieve similar results.
They also give the following details, which are testable predictions in the model:
Active management requires frequent buying and selling in an effort to outperform a specific benchmark or index.
Passive management replicates a specific benchmark or index in order to match its performance.
Active management portfolios strive for superior returns but take greater risks and entail larger fees.
I think this summarizes the general consensus about passive ownership, and is also broadly consistent with the model’s findings on informed and uninformed investors. In the model, relative to uninformed investors, informed investors (1) trade more (2) take more risk by loading up on the individual stocks (3) outperform the market (i.e. the ETF) on average.
There is one thing, however, that I think this definition is missing. What about informed investors executing a market-timing strategy? They may buy an ETF on the S&P 500 when they think the market is going to go up, and short the same ETF (or just stay out of it) when they think the market is going to go down. At any point in time that they are holding the ETF, it looks like they are passive (they are just replicating the index), even though they are actively trying to outperform this index. With this in mind, let’s see who actually holds ETFs.
Holdings of Institutional Investors
I construct three empirical measures ETF ownership: 1) What percent of an investor’s total long equity holdings are in ETFs 2) What is an investor’s total dollar holdings of ETFs 3) What percent of an ETF’s total shares outstanding are owned by a particular investor
I constructed these measures for groups of institutional investors based on Professor Bushee’s data. I merged his classifications with 13F filings – which are quarterly reports of holdings by large institutional investors.
Here is the first breakdown by type of institutional investor:
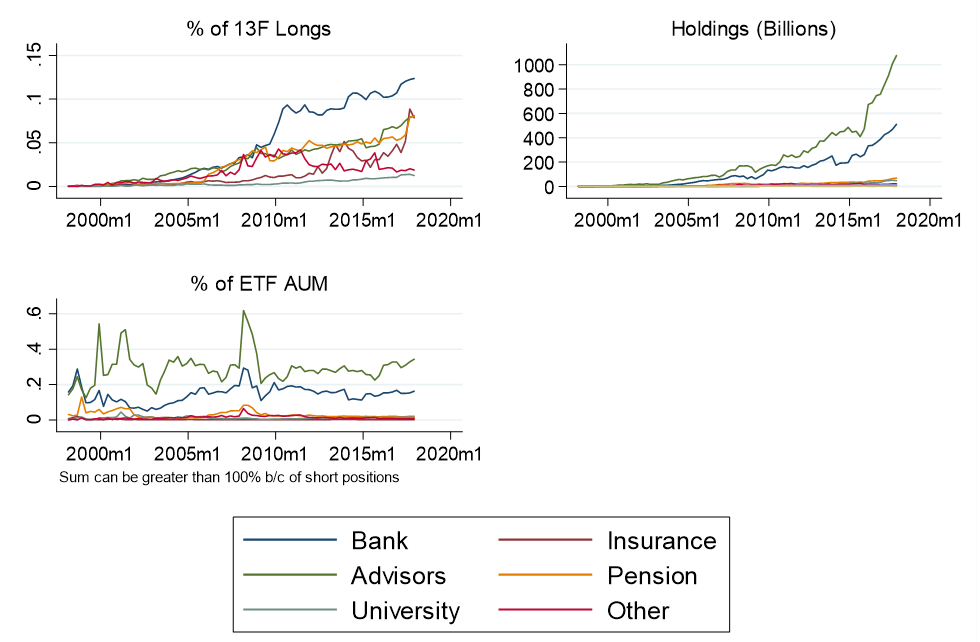 We can see that the two largest players in the ETF market are: (1) Banks and (2) Advisors (which includes hedge funds). I was not surprised that Advisors are large holders of ETFs – this is consistent with active investors executing market timing strategies. I was, however, surprised that banks now own about 20% of all equity ETF shares outstanding. My first intuition was that this is related to risk-weights in the Basel framework, but this document suggests otherwise.
I also do a breakdown by whether or not the institution is ‘tax sensitive’:
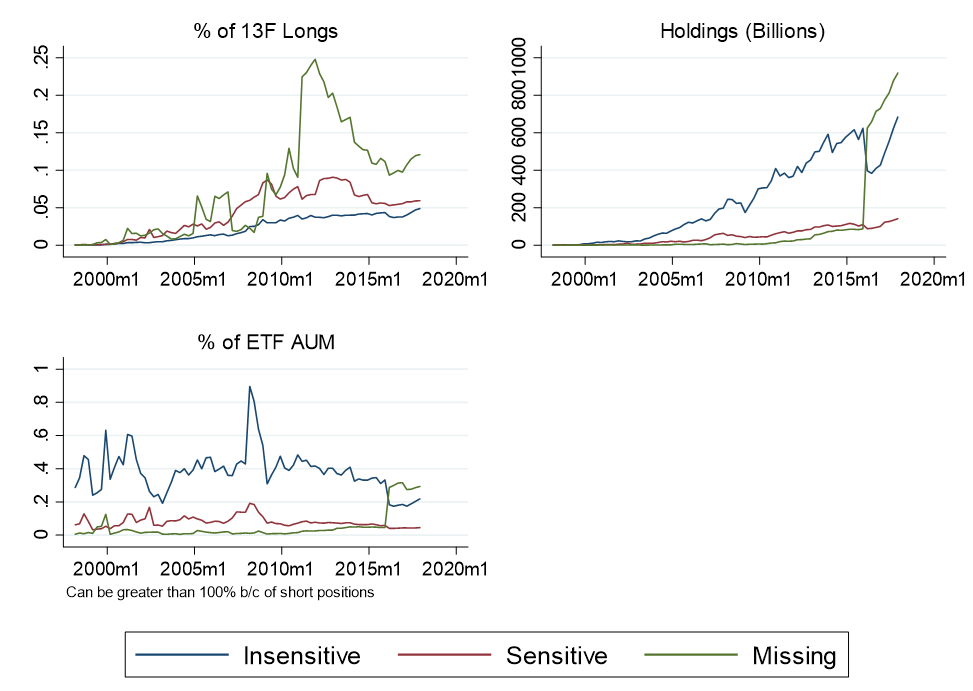 ETFs have many tax advantages relative to index mutual funds
(see this explanation by Fidelity) so its not surprising that ETFs are a larger part of tax sensitive institutions’ portfolios. There is, however, something puzzling about the bottom left panel of this figure: the shares manage to add up to more than one! The next subsection provides an explanation for this fact.
ETFs have many tax advantages relative to index mutual funds
(see this explanation by Fidelity) so its not surprising that ETFs are a larger part of tax sensitive institutions’ portfolios. There is, however, something puzzling about the bottom left panel of this figure: the shares manage to add up to more than one! The next subsection provides an explanation for this fact.
Who is Shorting ETFs?
In the last figure, we can see that the percent of ETF shares outstanding held by institutions added up to more than 1. This reveals a limitation of the 13F data: short positions are not reported. So if in the data, hedge funds are net short the ETFs, it’s possible that the long positions add up to more than the number of shares outstanding.
Here is a table from The Institutional ETF Toolbox (a great book if you want to get started in learning about ETFs). This table, which is based on data from Goldman Sachs Hedge Fund Monitor (2016), shows the long and short positions of Hedge Funds in ETFs:
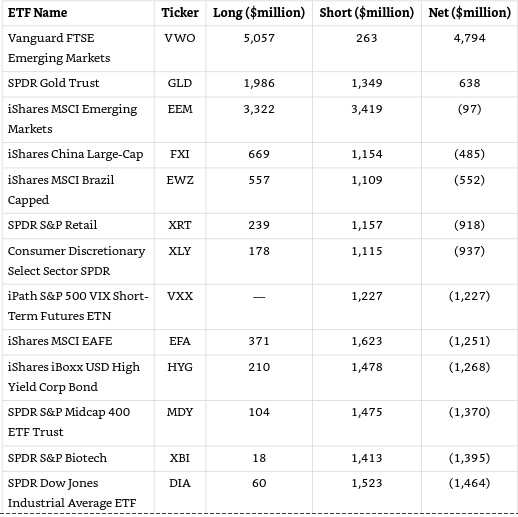
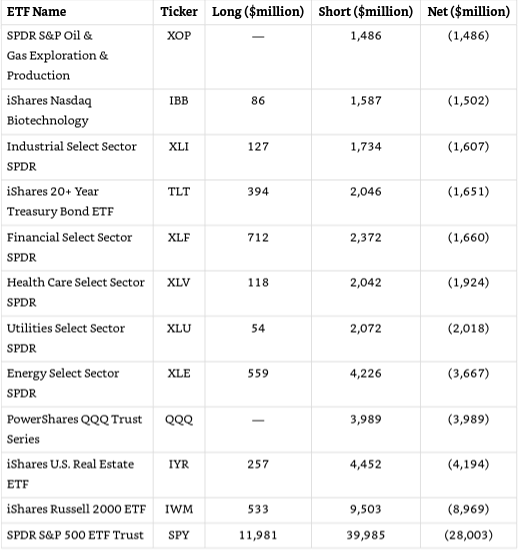
The table shows that hedge funds are net short almost all these ETFs! This means that the total dollars of hedge funds’ short positions in these funds is larger than their total long positions. This can also explain how there are more dollars in 13F longs in ETFs than there are in Total Net Assets (TNA) in the same ETF: If hedge funds are heavily shorting ETFs, they are effectively taking the opposite side of these long positions. If I borrow a share of SPY from you, and sell it to someone else, you still have your long position on your book, and now the person I sold it to also has the long position on their book.
If we check out some data from ETF.com we can see that some of these short positions are massive at the individual-ETF level. At the time of writing (late June 2020), over 500% of the retail sector ETF (XRT) was short:
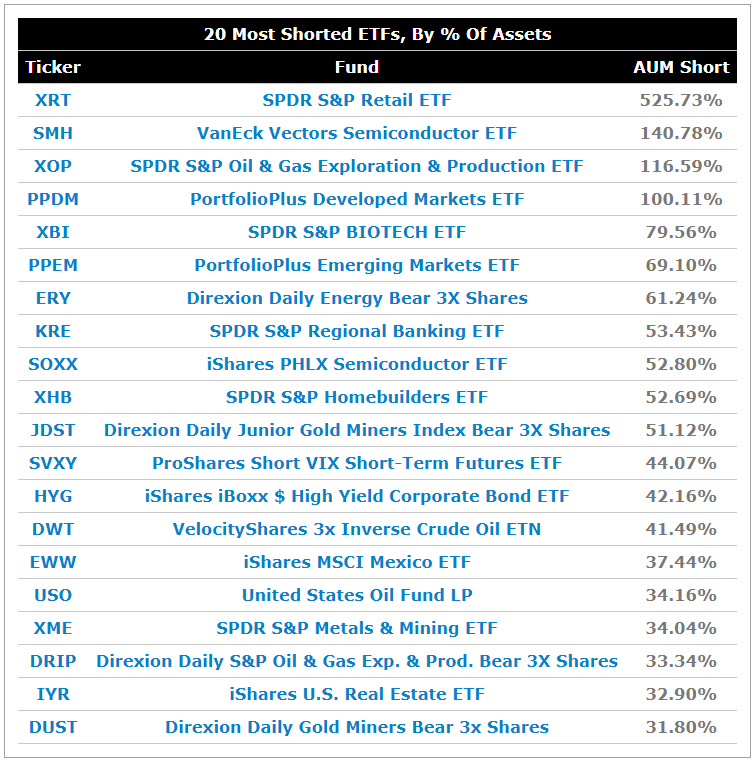
This is consistent with the bankruptcies of large retail firms during COVID-19 like J.Crew JCPenny and Neiman Marcus.
Wrap Up
In the model, informed investors take aggressive bets on individual stocks, while hedging out systematic risk with the ETF. Uninformed investors take the other side of this trade, buying the ETF from informed investors. From this alone, it seems like uninformed investors are similar to passive investors in the data, while informed investors are similar to hedge funds, which are presumably active investors.
This, however, is not the whole story. Informed investors may decide to learn about systematic risk, and bet long on the ETF. Consistent with this, in the data, hedge funds have some of the largest long positions in ETFs. In this instance, my empirical paper would classify them as ‘passive’ investors, even though they may really be doing a market-timing (active) strategy. On top of that, there are many investors who label themselves as active, who actually hold diversified portfolios (see e.g. data from Antti Petajisto). While I think the general consensus is mostly correct about how to classify passive and active management, some nuance needs to be applied to match the model to the real world.