Are Momentum Funds Momentum Funds?
There have been many papers (e.g. Jegadeesh Titman 1993) documenting momentum – the phenomenon where stocks that went up in the past keep going up, while stocks that went down in the past keep going down. This means it should be a profitable trading strategy to buy ‘winners’ (stocks that went up), and sell ‘losers’ (stocks that went down). In practice, however, this strategy requires a lot of rebalancing – the winners and losers are always changing – so it may be difficult for the average investor to actually trade on momentum.
As an alternative, some mutual fund and ETF companies have started offering momentum funds: you pay them a management fee, and they execute momentum for you. Before investing in one of these funds, however, you probably want to know how close the “momentum” you’re buying is to the momentum in academic research.
In this blog post, I will review a basic momentum strategy, examine the growth of momentum mutual funds, and see how much these funds’ returns look like the returns to the momentum trading strategy.
Review of Momentum
There are many ways to trade on momentum, but one way is to assign firms to portfolios based on their returns over the past year. Specifically, calculate the cumulative returns for each stock from months t-12 to t-2 (exclude the return in month t-1). Then, sort firms into 10 groups based on their cumulative returns over this period. Finally, go long the firms that went up the most (top 10%), and go short the firms that went down the most (bottom 10%).
This strategy has historically performed well. Here is a plot of the value of $1 invested in this strategy in 1930 (all data here is from Kenneth French’s Data Library):
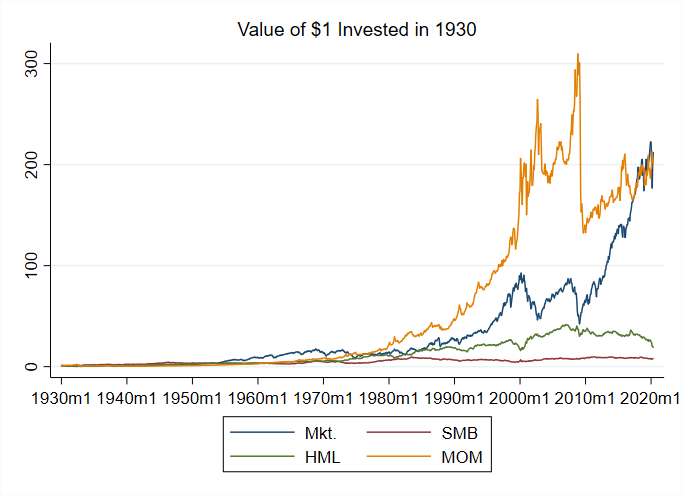
I have also included the value of $1 investments in a strategy which is long small stocks, and short big stocks (SMB i.e. the size effect) and a strategy which is long value stocks and short growth stocks (HML i.e. the value effect). I also included an investment in the market, financed by borrowing at the risk-free rate. This is so all of these portfolios are computed using excess returns and it is an apples-to-apples comparison.
If it wasn’t for the crash after the financial crisis, the momentum strategy would seem far superior to the other strategies considered. This is a reminder that even though momentum had higher returns, and a higher Sharpe ratio than the market when many of the famous momentum papers were written, trading on this strategy it is not without risk. The momentum strategy lost more than half its value in the span of a few months, wiping out most of the gains it had relative to the market as a whole.
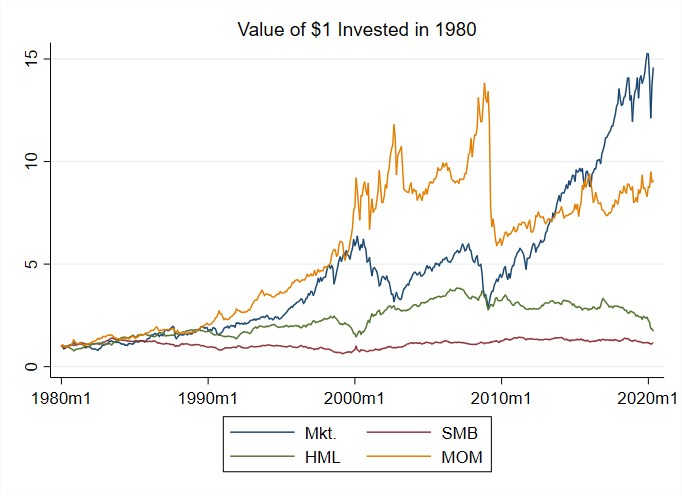
Here is the same plot, but starting in 1980. Momentum had outperformed the market by a factor of about 2x before the crash:
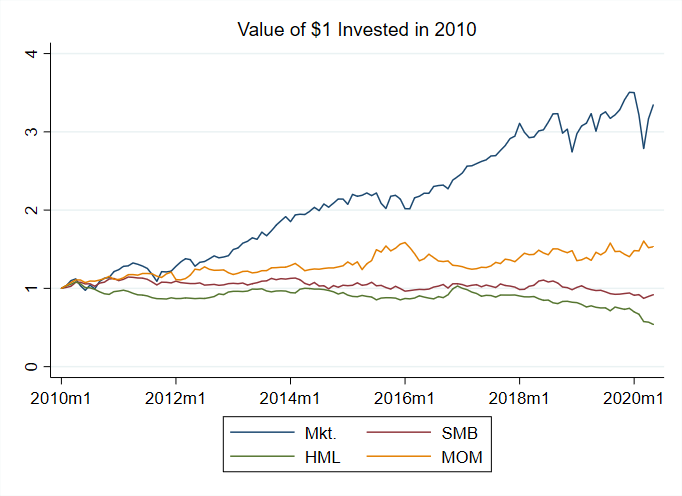
Here is a plot starting in 2010, after the crash. Momentum has under-performed the market as a whole:
Finally, here is a plot starting in 2018:
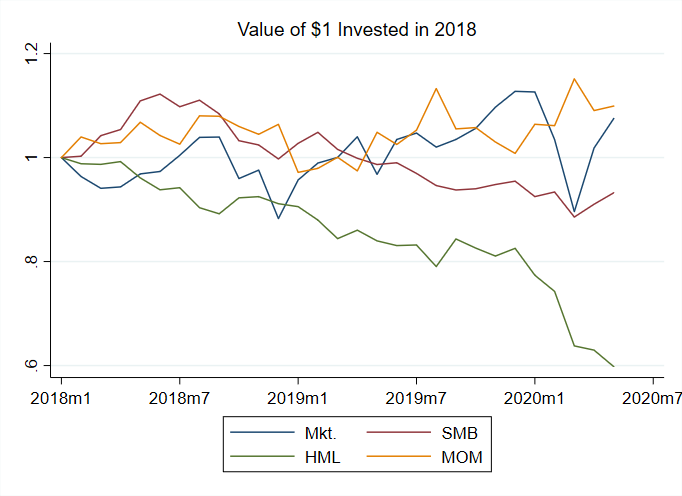
From these figures, we can see momentum did very well up until around the 2000’s. Then it experienced some volatility and a big crash. After 2010, it did worse than the market, although recently it has been performing similarly to the market.
Given momentum’s poor recent performance, it is surprising that momentum funds have grown as substantially as they have over the past 20 years, as I will show in the next subsection.
Momentum Mutual Funds
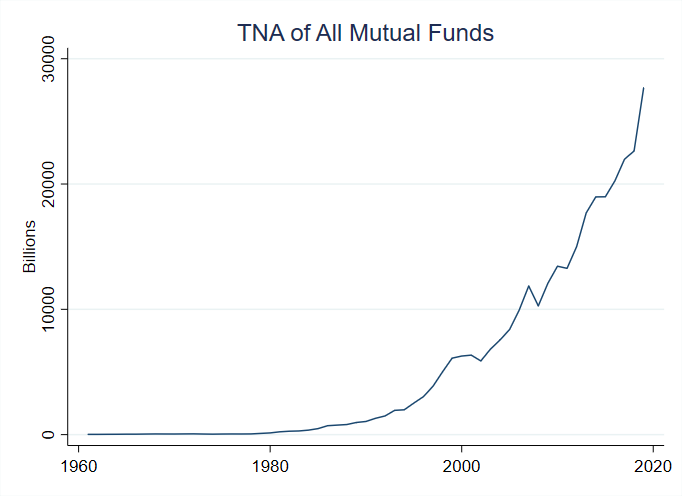
The mutual fund/ETF industry has grown massively over the past 20 years. Below, I plot the TNA (total net assets) in billions of all mutual funds/ETFs (I will use the terms interchangeably in this blog post). Note that this includes mutual funds that do not hold stocks, which is why these numbers seem large relative to the whole value of the stock market.
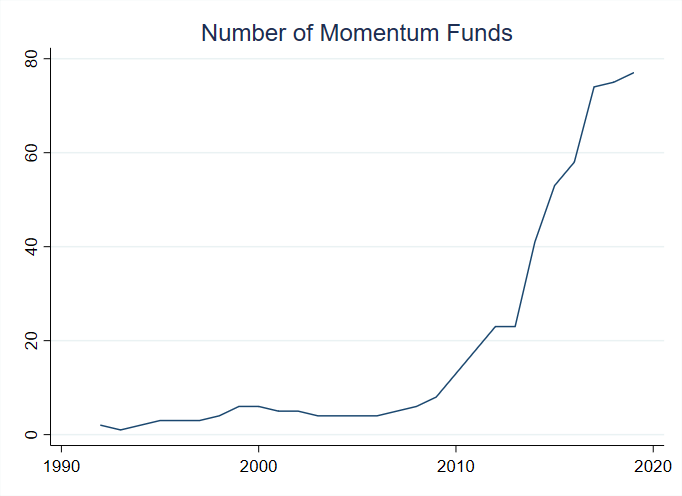
Using the CRSP mutual fund data, I identify momentum funds as funds with momentum in the name, and which hold at least 50% of their assets in equities (it turns out momentum exists in many asset classes, see e.g. Assness and Moskowitz 2013). The number of momentum funds has grown, especially after the momentum crash around 2010:
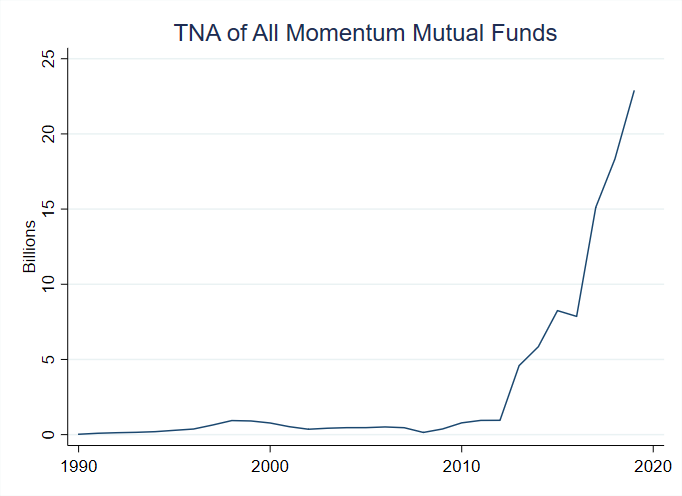
The total size of these funds is now near $25 Billion:
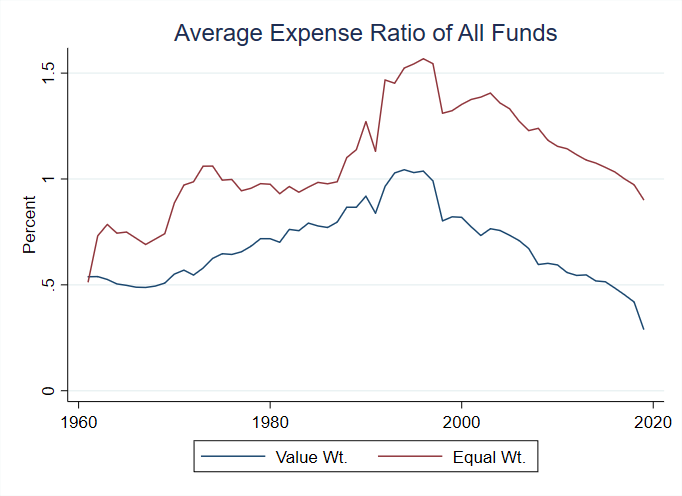
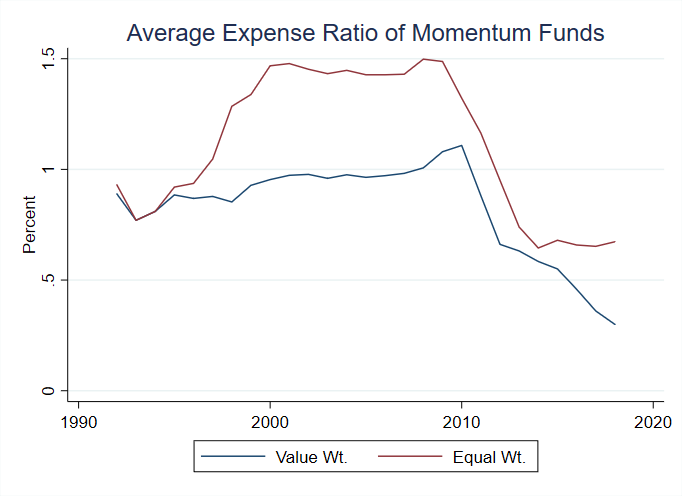
As I said, momentum requires a lot of trading, so I wanted to know how much asset management companies are charging for executing momentum on your behalf. Here are the average fees of mutual funds with at least 50% of their assets in equities. These fees may seem high, but it includes active funds.
Here are the fees for the average index fund, which have gone toward zero in recent years:
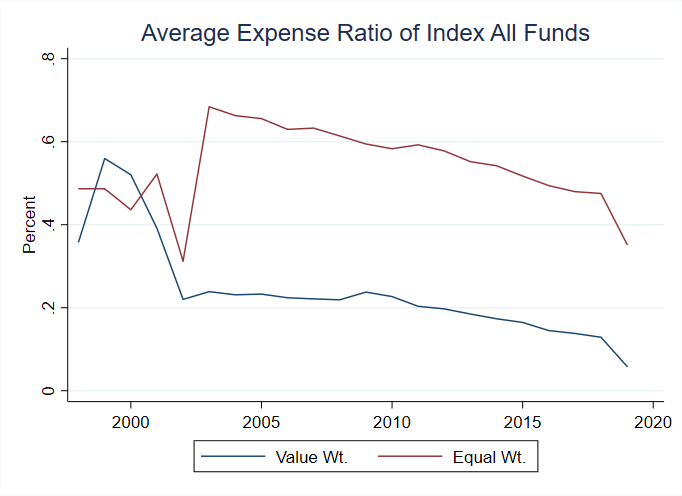
Momentum fund fees look similar to fees for the average fund – but are high relative to index funds (e.g. 0.095% for SPY), which have outlasted and outperformed all these momentum funds (more on this below):
Further, you can’t justify this as an active strategy; momentum is based on mechanical rules and does not require active ‘stock-picking’.
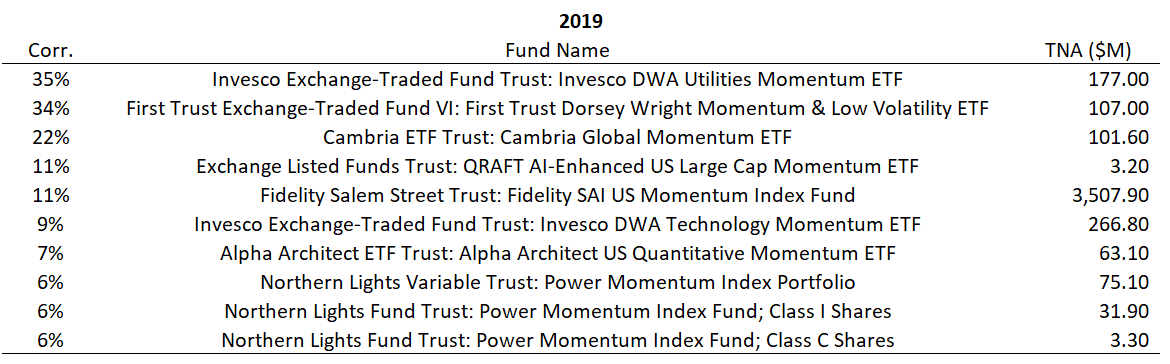
Here is a list of the biggest momentum funds as of 2019:
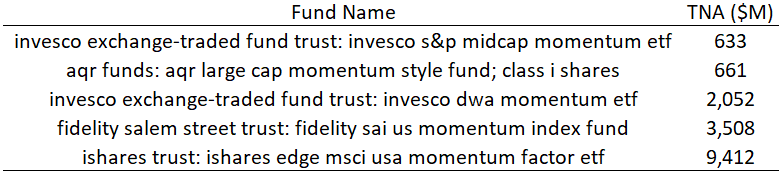 There is a lot of concentration in this industry, with more than 10% of all momentum fund assets in the largest fund.
With the growth of the momentum fund industry in mind, let’s look at these funds’ performance.
Are Momentum Funds Momentum Funds?
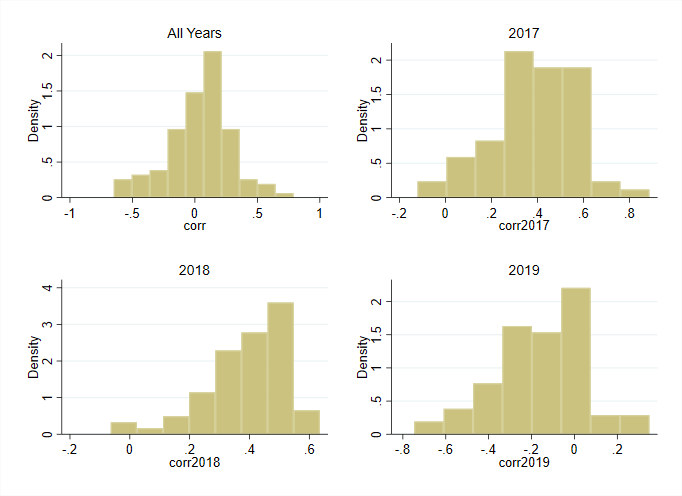
The most accurate way to tell if these funds are implementing the momentum strategy I outlined above is to look at their holdings and see if they differ from the holdings predicted by the strategy. For simplicity, I just look at the correlation between the daily returns of the momentum strategy and the daily returns of the funds.
Here are some histograms of the distribution of this correlation overall, and by year. Note that for the whole sample, the distribution is centered barley above zero!
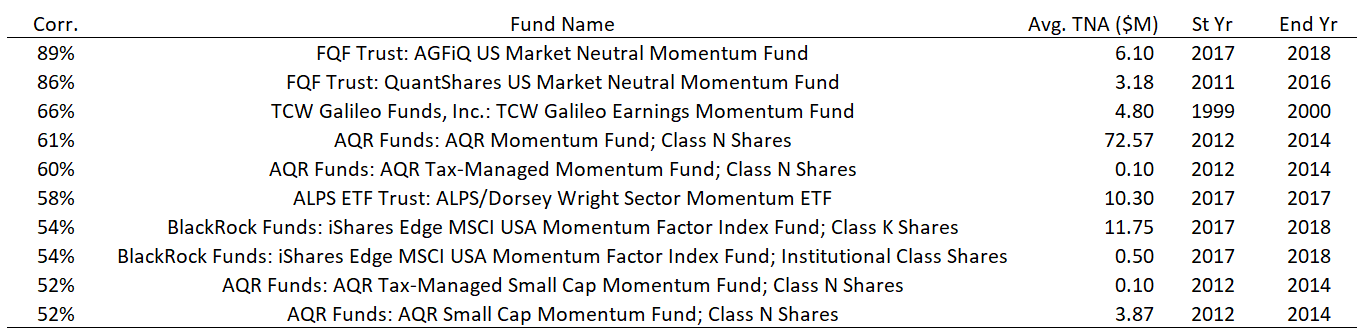
Here are the top 10 funds overall by correlation, note that many of these funds had short histories, so the correlation may be spurious:
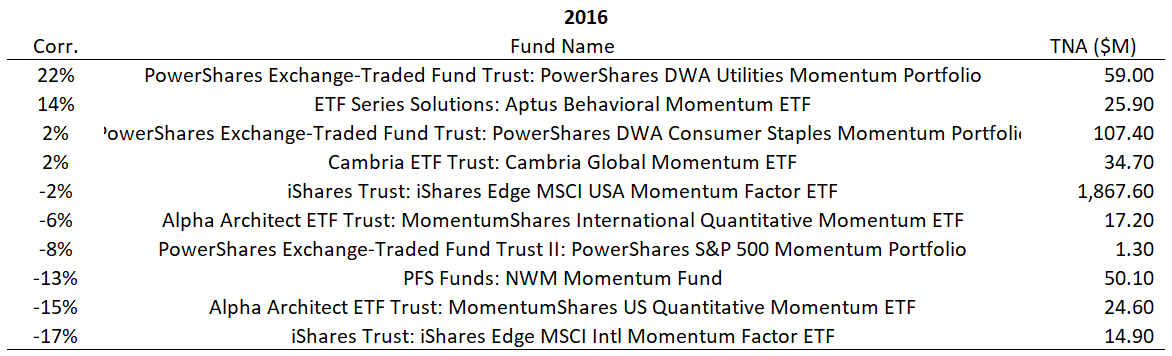
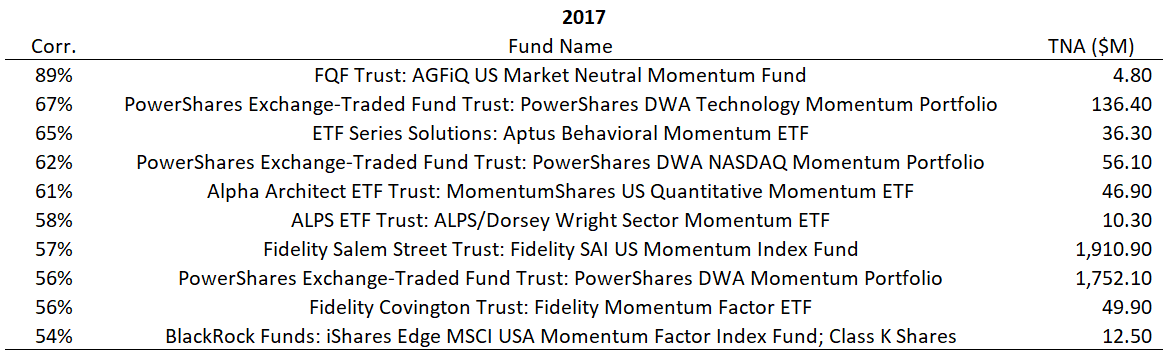
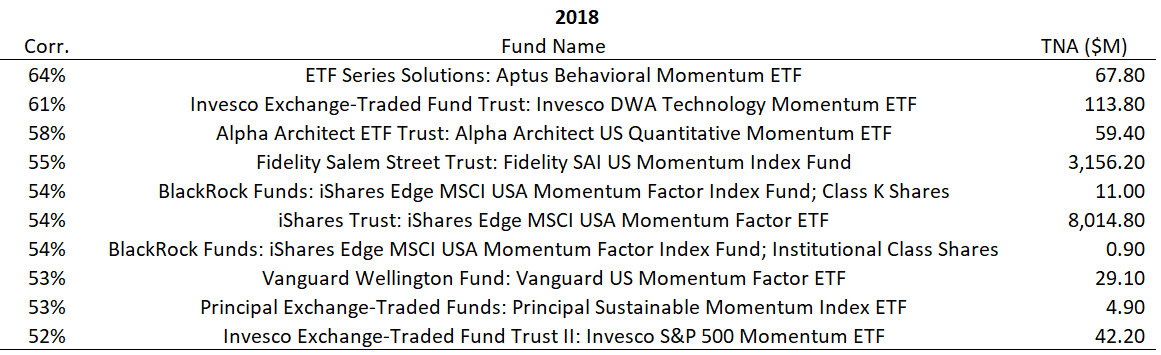
And here are the top funds by correlation with the basic momentum strategy for a few selected years:
And how have these funds done if they are not closely tracking momentum? Well, the average momentum fund looked a lot like the market from 2000-2012, and has done worse than the market since then.
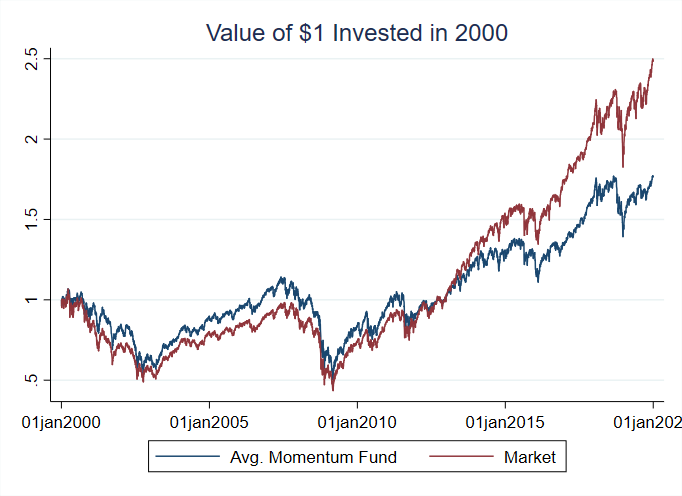
Note also that the momentum funds did not experience the momentum crash at the end of the financial crisis – more evidence that these funds are not actually trading on momentum (or that the managers were smart enough to avoid it…).
Wrap Up
It seems like momentum funds are not really momentum funds. They don’t seem to be executing the ‘academic’ momentum strategy, with average correlations in some years, like 2016, near zero. Further, they charge higher fees, and have similar, or have worse performance than the market as a whole. I guess at least as of now, there is no substitute for directly trading on momentum.